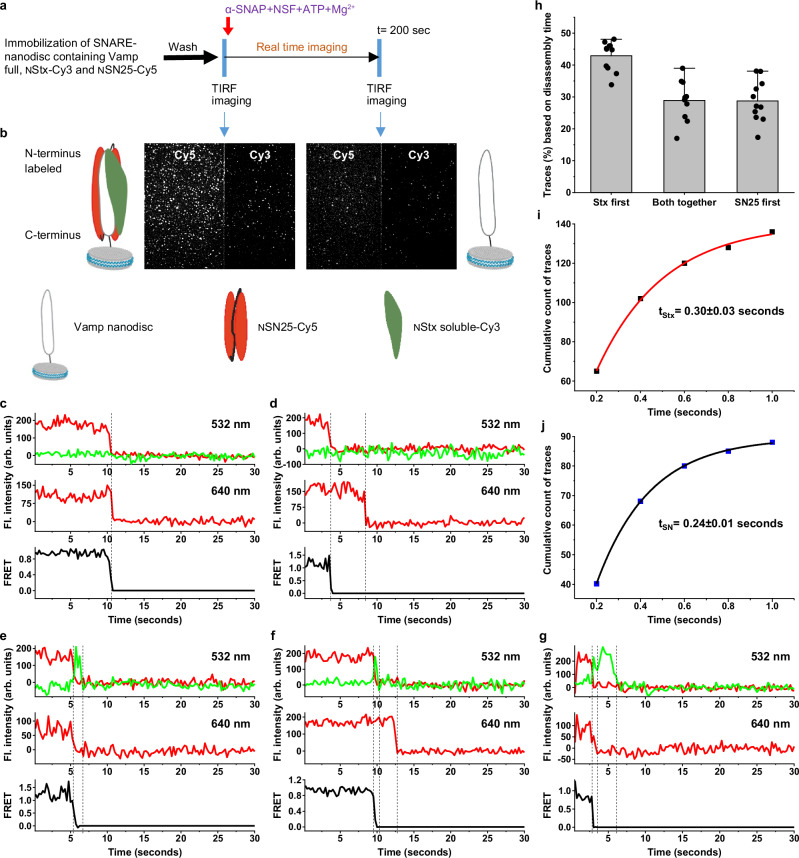
Fig. 2. SNARE disassembly by NSF monitored using single-molecule FRET.
a Procedure of the smFRET assay of SNARE disassembly by NSF using TIRF microscope. b TIRF microscopy images FRET pair, Cy3 and Cy5 fluorescence channels representing SNARE-nanodisc after immobilisation along with a pictorial representation of nanodisc present on the glass slide before and after the disassembly by NSF. c–g Single-molecule trajectories of the NStx-Cy3 (green), NSN25-Cy5 (red) and FRET (dark grey) collected under the ALEX cycle between 532 nm and 640 nm lasers during the disassemble. Fl., fluorescence, Arb., arbitrary. c a representative trace showing both the NStx-Cy3 chain and NSN25-Cy5 chain disassembling at the same time. d a representative trace where the NStx-Cy3 chain disassembles first, followed by the NSN25-Cy5 chain. e a representative trace where the NSN25-Cy5 chain disassembles first, followed by the NStxCy3 chain. f a representative trace where a separation of the NStx-Cy3 chain is observed, followed by NStx-Cy3 disassemble first and then the NSN25-Cy5 chain. g a representative trace where a separation of the NSN25-Cy5 chain is observed, followed by NSN25-Cy5 disassemble first and then the NStx-Cy3 chain. h Classification of the single molecule traces based on the chain disassembly time (n = 11, each n represents an independent SNARE disassembly assay), data shown as mean ± SD. i, j Graphs showing the average lifetime of the chain separated state before the chain disassembly, 0.30 ± 0.03 seconds in case of traces (f) and 0.24 ± 0.01 s in case of traces (g). The dotted lines show the FRET separation and chain disassembly in traces (c–g).

