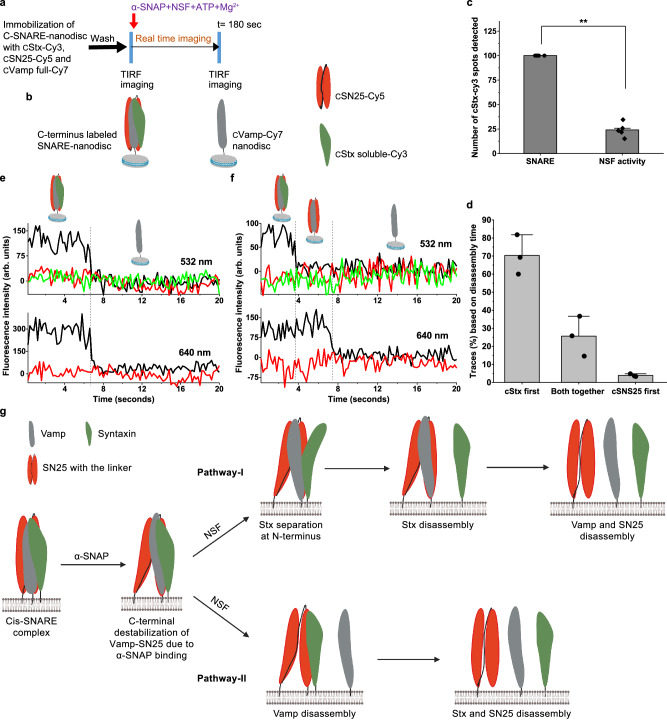
Fig. 5. Vamp anchored C-SNARE-nanodisc disassembly by NSF monitored using three-colour single-molecule FRET.
a Procedure of the smFRET assay of C-SNARE disassembly by NSF on TIRF microscope. b Pictorial representation of SNARE-nanodisc with N- and C-terminal end labelling. c Relative percentage of spots detected in the cStx-Cy3 channel before and after the disassembly. p = **< 0.01, two-tailed paired t test, n = 5, individual experiments from multiple sample preparations. Values are mean ± SD. d Percentage of the classified traces based on the chain disassembly time, n = 3, each n is data from an independent sample preparation with 2-3 experiments from each sample. Values are mean ± SD. e, f Single-molecule trajectories of the cStx-Cy3 (green), cSN25-Cy5 (red) and cVamp-Cy7 (dark grey) during the C-SNARE disassembly. e a representative trace showing both cStx-Cy3 and cSN25-Cy5 chains disassemble at the same time from cVamp-Cy7. f a representative trace where cStx-Cy3 disassembles first, followed by cSN25-Cy5. g Pictorial representation of plausible major pathways of SNARE disassembly by NSF (Created in BioRender. Cheppali, S. (2024) https://BioRender.com/f62r845). Binding of α-SNAP itself can induce destabilization at the C-terminal end of the cis-SNARE complex. The attachment of NSF and the ATP hydrolysis leads to SNARE disassembly in two major sequential pathways. Pathway I shows sequential disassembly with Stx separated intermediate and proceeds through Stx disassembles first and Pathway II, where sequential disassembly occurs with Vamp disassembles first.

