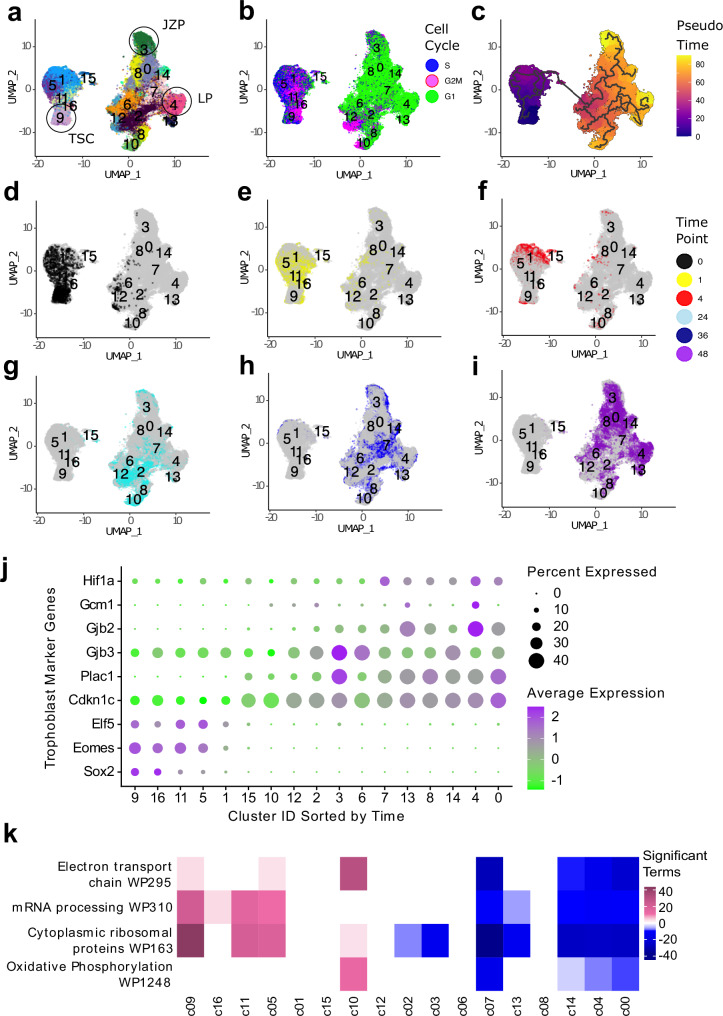
Fig. 3. Clustering of Inhibit dataset.
a-i UMAP grid of the Harmony-integrated Inhibit TSC differentiation dataset. a UMAP coloured by cluster, resolution = 0.8. TSC = Trophoblast stem cells, JZP = Junctional zone progenitors, LP = Labyrinth progenitors. b UMAP coloured by assigned cell cycle phase using the Seurat function CellCycleScoring. c UMAP coloured by Pseudotime using Monocle3. d–i UMAPs with cells coloured at timepoints: 0 h (d) 1 h (e) 4 h (f) 24 h (g) 36 h (h) and 48 h (i). j Dotplot of marker genes expressed in the Inhibit dataset. Markers were selected from literature and grouped by differentiation trajectory. (TSC markers: Eomes, Elf5, Sox2. JZP markers: Cdkn1c, Gjb3, Plac1. LP markers: Gjb2, Gcm1, Hif1a.) The size of the dots represents number of cells that express the marker. The colour of dots represents the average expression of the marker in each cluster, scaled for the dataset. All values were mean centred for each gene. Clusters were ordered on the x-axis by time using the R package Tempora with undifferentiated cells to the left of the x-axis. k Heatmap of gene expression in top WikiPathways in the Inhibit dataset. Pink and blue represent enrichment or under-representation of a pathway in each specific cluster, respectively. Clusters on the x-axis are ordered by Tempora with stem cells on the left.

