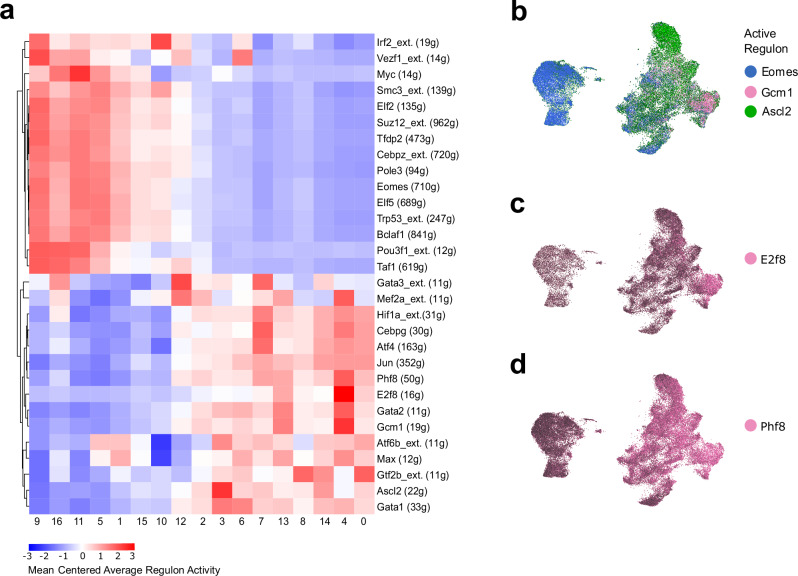
Fig. 4. Active regulons in the Inhibit dataset.
a Heatmap of regulon activity that co-occurs with known TF markers for LP and JZP identities. JZP identity was assigned by detecting clusters with high activity of the Ascl2 regulon (c3), and LP identity by the Gcm1 regulon (c4). Difference between JZP cluster activity and LP cluster activity was calculated for each regulon. Top 10 regulons for highest and lowest ratio, as well as top 10 regulons with highest activity in t0 cluster (cluster 9) were selected for the heatmap. Colour represents average score for the activity of a regulon for each cluster. All values were mean centred for each regulon and number of genes in the regulon is shown in brackets. The suffix _ext. in the regulon name indicates lower confidence annotations (by default inferred by motif similarity) are also used. b-d Specific SCENIC transcription factor regulons co-localize with TSCs, and cells associated with JZP and LP lineage. Cells were coloured by AUC score for regulons of interest. (b) UMAP plot of Inhibit dataset coloured by regulon activity. The TSCs-specific regulons Eomes are coloured blue, JZP regulon Ascl2 is coloured green, and LP regulon Gcm1 is in pink. c UMAP plot of Inhibit dataset coloured by E2f8 regulon activity. E2f8 regulon activity overlaps Gcm1 activity. d UMAP plot of Inhibit dataset coloured by Phf8 regulon activity. Phf8 regulon activity is increased over time in LP cells and overlaps with E2f8 and Gcm1 activity.

