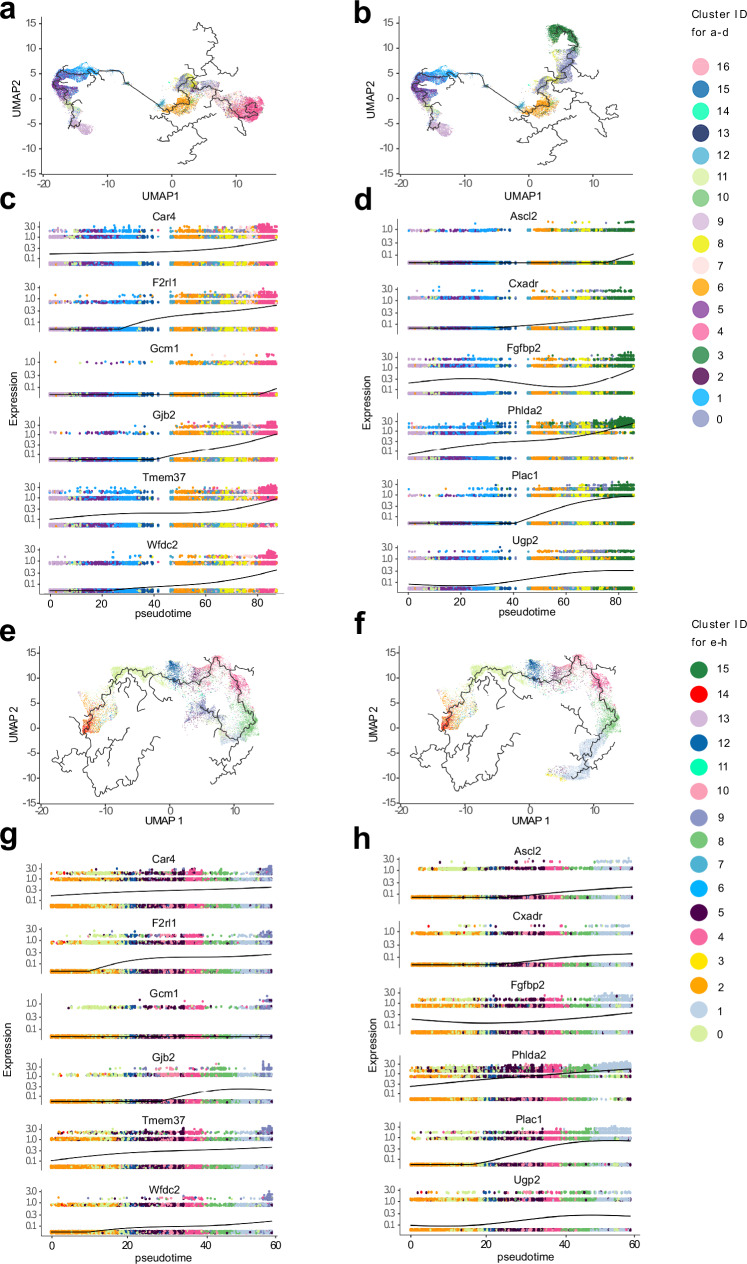
Fig. 5. Pseudotime trajectories of Inhibit and Remove datasets.
a,b JZP and LP trajectories can be defined from pseudotime. Analysis of branches in single cell pseudotime trajectories in Inhibit dataset. Pseudotime was calculated with Monocle 3 to measure how much progress an individual cell has made through a process of TSC differentiation. Cells were coloured by cluster identity. a LP trajectory in Inhibit dataset. b JZP trajectory in Inhibit Dataset. Branches were selected by identifying start node (cluster 9 with T0 cells) and end node (nodes at the end of JZP and LP identified clusters). c, d Expression of JZP and LP-specific genes in pseudotime across their trajectory branch. Branches of pseudotime trajectories were selected by assigning earliest principal node with highest number of t0 cells as a start and end principal node of differentiated JZP or LP cluster as end and connecting the shortest path between the points. Branches were then plotted on UMAP with cells coloured by cluster. Genes shown are a combination of known markers and ones from the top list. c Expression of LP genes across pseudotime in Inhibit dataset. d Expression of JZP genes across pseudotime in Inhibit dataset. e JZP trajectory in Remove dataset. f LP trajectory in Remove dataset. Branches were selected by identifying start node (cluster 14 with T0 cells) and end node (nodes at the end of JZP and LP identified clusters). g Expression of JZP genes across pseudotime in Remove dataset. h Expression of LP genes across pseudotime in Remove Dataset.

