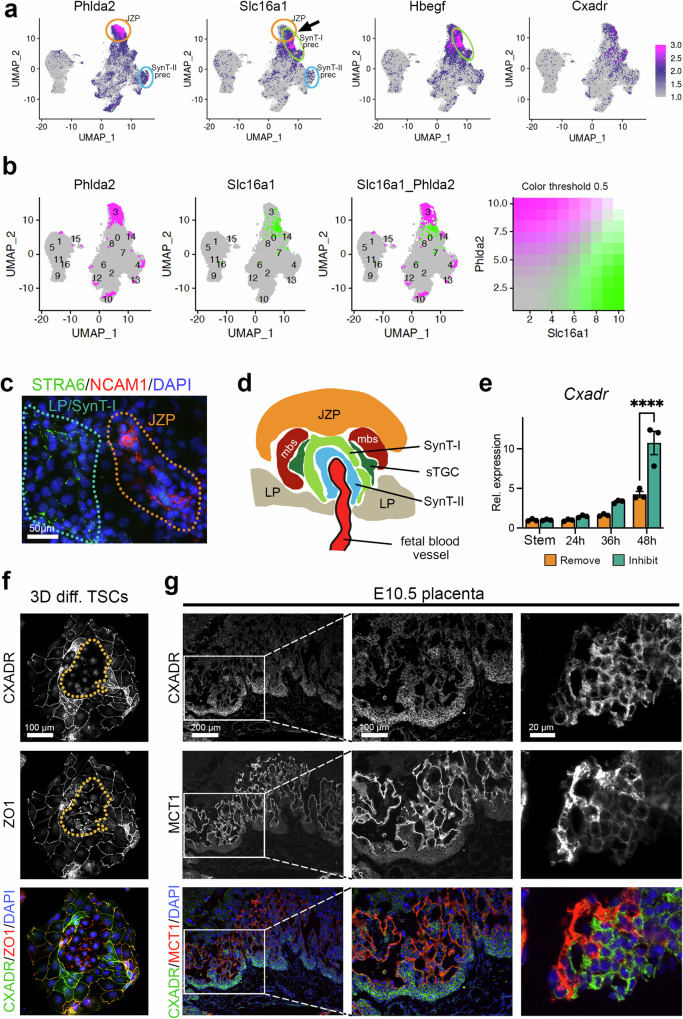
Fig. 7. Expression dynamics of labyrinth progenitor marker CXADR.
a UMAP plots of the Inhibit dataset of genes enriched in the presumptive JZP cluster. Phlda2 is a well-known marker of the JZ. Yet SynT-I markers Slc16a1 and Hbegf are enriched in the same or adjacent cluster (arrow), as is Cxadr. Colour gradient shows normalised expression. b UMAP plots of locations of cells with top 10% expression of Phlda2, Slc16a1 and overlap between the two cell populations. c Immunostaining for SynT-I marker STRA6 (green) and junctional zone marker NCAM1 (red) reveals non-overlap between individual LP and JZP cells entering these lineages. Staining was carried out after 48 h of culture in Inhibit conditions. Image is representative of three independent experiments. d Diagram depicting the organization of emerging trophoblast cell types at sites of fetal vessel invagination into the chorionic ectoderm. JZP = junctional zone precursor, mbs = maternal blood space, sTGC =sinusoidal trophoblast giant cell, LP = labyrinth precursor. e Cxadr expression dynamics across the 48 h differentiation time course in Inhibit and Remove conditions. During these early stages of differentiation, Cxadr expression is up-regulated, in particular in Inhibit conditions that promote LP differentiation. Data are normalized to stem cell conditions and plotted as mean +/- SEM of three independent replicates. Statistical significance was calculated using 2-way ANOVA. **** p < 0.0001. Source data are provided as a Source Data file which contains exact P values. f Representative image of differentiated TSCs at 3 days (3D) of differentiation stained for CXADR (green) and cell membrane marker ZO1 (red). The encircled area highlights early-stage syncytializing cells that have lost CXADR while still retaining some ZO1. Image is representative of three independent experiments. g E10.5 placenta stained for CXADR (green) and MCT1 (red) showing the immediately adjacent localisation of CXADR-positive single cells to syncytial MCT1-positive cells. Images are representative of n = 4 placentas. The middle column of images depicts a higher magnification of the boxed area in the left column. The right-hand column of images depicts an area at the base of the placental labyrinth taken from a consecutive section of that shown on the left. Images are representative of three independent samples.

