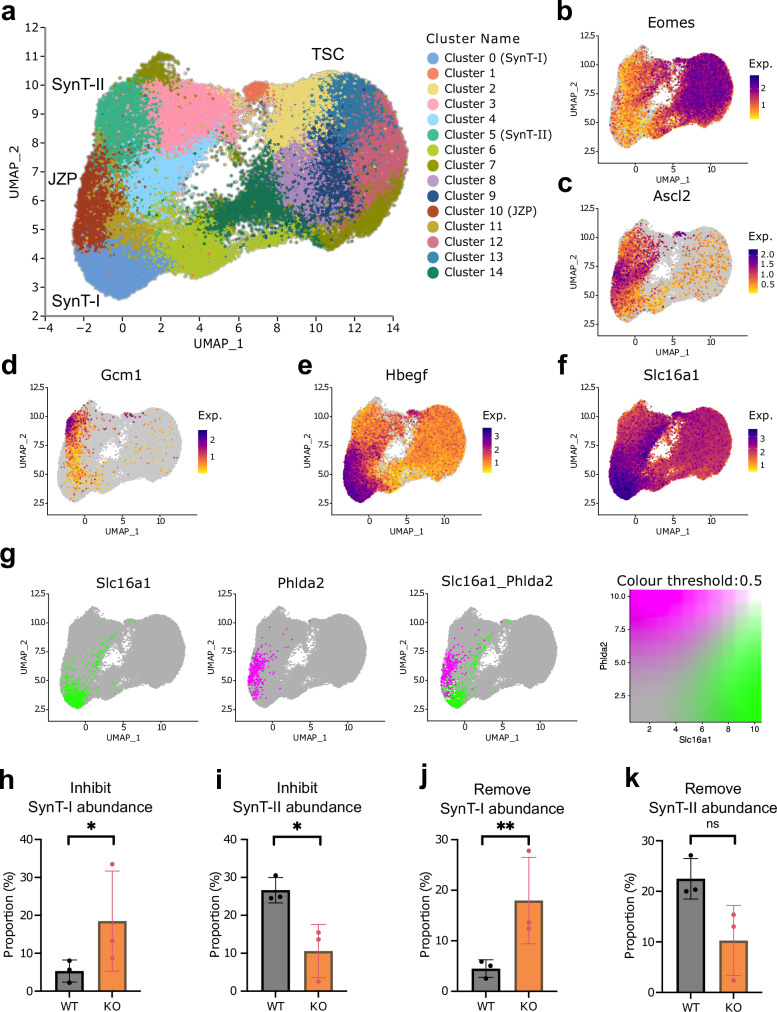
Fig. 9. scRNA-seq of Cxadr KO TSCs.
a UMAP of Inhibit dataset at t0 and t24 containing WT and Cxadr KO cells (resolution 0.7). Cluster 5 is identified as SynT-II, Cluster 0 as SynT-I, Cluster 10 as JZP. b UMAP plot of Eomes expression. c UMAP plot of Ascl2 expression. d UMAP plot of Gcm1 expression. e UMAP plot of Hbegf expression. f UMAP plot of Slc16a1 expression. Exp = Normalised expression g UMAP plot of the locations of the top 10% cells by Slc16a1 (green) and Phlda2 (magenta) gene expression in the Inhibit dataset and the overlap between those populations (white). h Proportion of SynT-I cells (cluster 0) in the Inhibit dataset split by sample of origin. p = 0.035. i Proportion of SynT-II cells (cluster 5) in the Inhibit dataset split by sample of origin. p = 0.016. j Proportion of SynT-I cells (cluster 13) in the Remove dataset split by sample of origin. p = 0.007. k Proportion of SynT-II cells (cluster 6) in the Remove dataset split by sample of origin. p = 0.094. Data shown in h–k are mean +/- SD and n = 3 independently derived cell clones. * <0.05, ** <0.01, ns = not significant in an empirical Bayes framework moderated two-sided t-test using the propeller function from R package speckle (see Methods). Source data are provided as a Source Data file.

