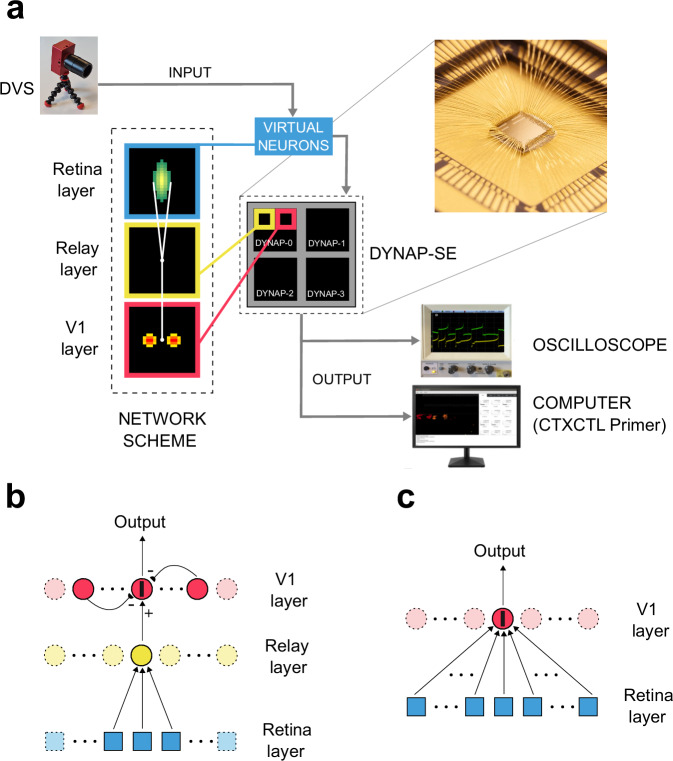
Fig. 1. Connectivity scheme and overall system setup.
a The overall system setup detailing how the model network has been physically mapped on the DYNAP-SE board and a close-up visual of the neuromorphic chip DYNAP-SEL. The DVS sensor output is reproduced by a population of spiking virtual neurons that act as spike generators for the physical silicon neurons on the DYNAP-SE chips. The board can be connected to an oscilloscope, to observe the membrane voltage of selected silicon neurons, and to a computer, through the CTXCTL Primer interface, to monitor the spiking activity of the four chips in real-time. A diagram of the connectivity scheme between the network’s layers is shown in the insets for the retina layer, the relay layer, and V1 layer: green shadings refer to excitatory feed-forward connection, whereas red’s refer to the clustered recurrent inhibitory connections. b One-dimensional representation of the recurrent network interconnection scheme: the target neuron, labeled by a black bar on the V1 layer, receives feed-forward excitation from neurons of the retina layer (cf. the elongated region in the inset of panel a), and recurrent inhibition from V1 neurons located at a fixed distance and displaced symmetrically along an orientation equal to the selectivity bias provided by feed-forward afferent connections (cf. the two red circular clusters in the inset of panel a). The angle of the bar indicates the orientation to which the neuron will be eventually sensitive according to such connectivity scheme. The same pattern of connections is repeated for every neuron of the V1 layer. c One-dimensional pictorial representation of the interconnections of an equivalent strictly feed-forward network, highlighting the larger extent of interconnections (light blue squares on the retina layer) required to obtain the same RF.

