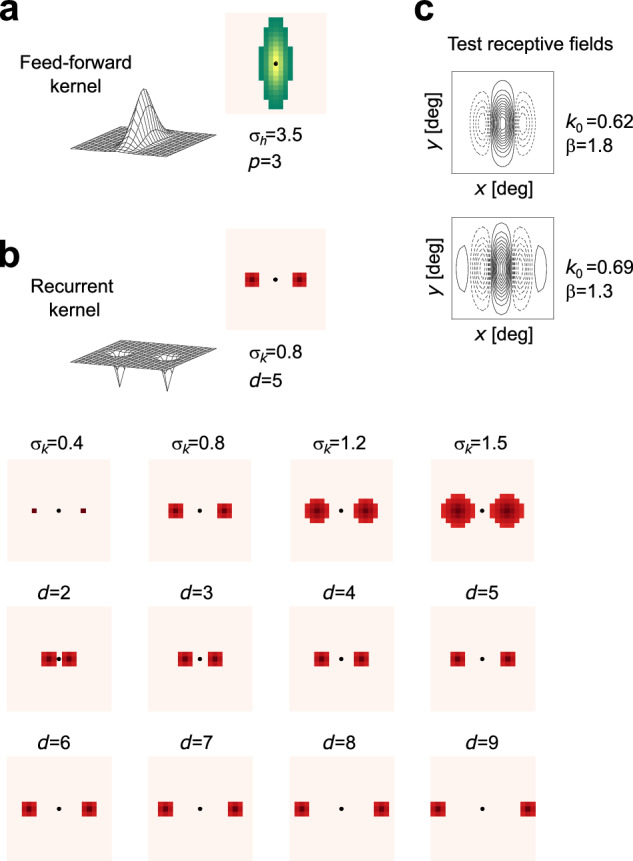
Fig. 2. Connectivity kernels and test RFs.

Mesh plots and top-view schemes of the feed-forward kernel (a) and of the feed-back kernels of the recurrent network (b), for the different parameter settings considered. Black dots indicate the position of the target neuron of the V1 layer that receives excitation through the feed-forward kernel on the retina layer, and recurrent inhibition through the feed-back kernel on the V1 layer. This connection scheme is replicated for every neuron of the V1 layer. c Representation of the RFs obtained—for the sake of comparison—direcly through two strictly feed-forward test networks.
