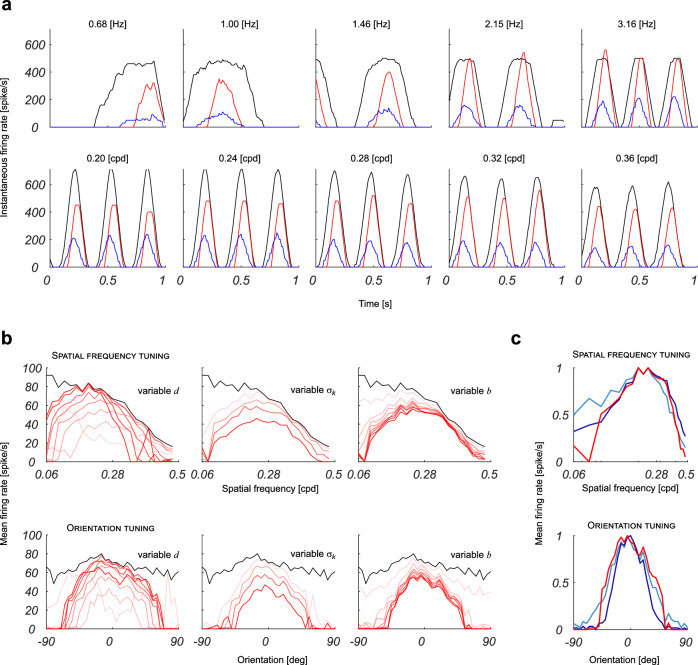
Fig. 3. Characterization of the RFs emerging from the simulated network.
a The top row shows the response to moving gratings with a fixed spatial frequency of 0.28 cpd and temporal frequencies that vary as indicated; the bottom row shows the response to moving gratings with a fixed temporal frequency of 3.16 Hz and variable spatial frequencies that vary as indicated. Red and black curves refer to the instantaneous firing rates of the central neuron in the simulated V1 layer with and without recursion, respectively; the blue curve refers to the instantaneous firing rate of the afferent neurons in the simulated retina layer. As it can be observed, the firing rate of the neuron of interest in V1 oscillates with the same temporal frequency as the input in the retina layer, attesting to the linear behavior of the network. b Red lines represent the tuning curves for the central neuron of the simulated V1 layer for different values of the parameters d, and b. For each column, two parameters were set to fixed typical values (), whereas the third parameter varies between a minimum and maximum: (first column) 2 d 9 sampled with a step of 1, , = 3 ⋅ 103; (second column) = 5, 0.4 1.5 sampled with a step of 0.4, = 3 ⋅ 103; (third column) = 5, , b {1 ⋅ 102, 5 ⋅ 102, 1 ⋅ 103, 1.5 ⋅ 103, 2 ⋅ 103, 3 ⋅ 103, 4 ⋅ 103, 5 ⋅ 103}. Tuning curves obtained for increasing values of the variable parameters are represented with increasing color saturation. Black lines represent the curves obtained when the recurrent inhibition is removed. c Comparison between the tuning curves for the central neuron of the simulated V1 layer, obtained by the recurrent network for d = 5, = 1.2, and b = 3 ⋅ 103 (red line), and the neurons of the simulated test networks with Gabor-like feed-forward RFs with three subregions (light blue lines) and five subregions (dark blue lines).

