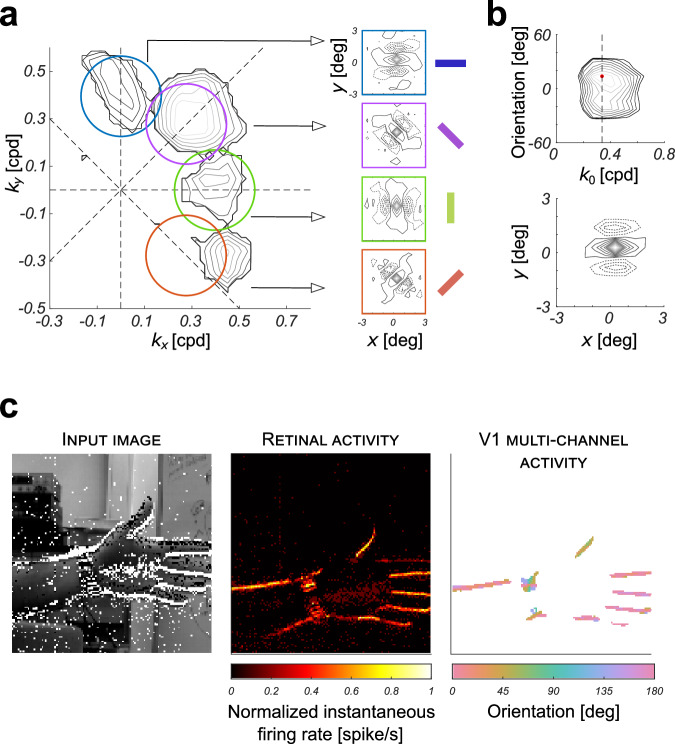
Fig. 6. Two-dimensional spectral response characterization and functional validation.
a Four examples of spectral response profiles of neurons of the simulated V1 layer (for θ = 0°, − 45°, 90°, and 45°) and the corresponding spatial kernels obtained by inverse Fourier transform. The colored contours indicate the -3 dB magnitude of the power spectrum Gabor filter responses of a theoretical orientation hypercolumn. b Average spectral response profile of neurons of the simulated V1 layer normalized with respect to orientation, and the corresponding spatial kernel obtained by inverse Fourier transform. Bandpass cutoff was set at −3 dB. The vertical dashed line identifies the radial peak frequency of the Gabor-like RF. c A snapshot of the measured activity of the DVS for a natural scene, the corresponding firing rate of the simulated retina layer, and the combined response of the simulated V1 layers obtained from four channels with different preferred orientations. The stream of events generated by the DVS is shown in the input image: ON and OFF events are represented as white and black squares overlaid to the corresponding image of the scene acquired with a regular frame-based camera. In the resulting retinal activity, brightest tones indicate higher firing rates. The V1 multichannel activity highlights the local dominant orientation value around each pixel, calculated as , where is the instantaneous firing rate of the corresponding neuron in the V1 layer, and θ ∈ {0°, − 45°, 90°, 45°} is the orientation of the Gabor-like filter. For the sake of simplicity in the visualization, only the neurons of the V1 (ON) layer with a firing rate above a given, fixed threshold (equal to 60% of the average maximum firing rate of the neuron population), were considered in the computation. Cropped DVS240 recording from DVSFLOW16 dataset60.

