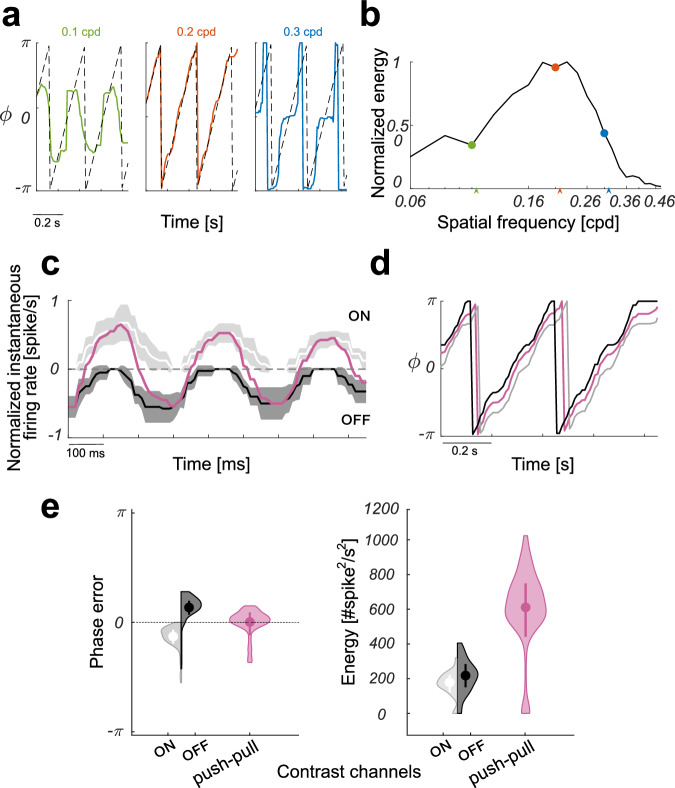
Fig. 7. Estimates of the dominant phase component for the push-pull configuration.
a Estimated dominant phase components ϕ for drifting sinusoidal gratings with different spatial frequencies and orientation coincident with the neuron’s orientation preference. The most reliable phase estimate (red plot) is obtained when the stimulus' spatial frequency matches the peak frequency of the Gabor-like band-pass filter (i.e., ks = 0.2 cpd ≃ k0). The actual (i.e., ground truth) phase signal is displayed for reference as black dashed lines. b Normalized energy E of the band-passed signals for a range of spatial frequencies. Low values of the local energy weaken the reliability of the phase estimates (see green and blue plots in panel a). c Normalized instantaneous firing rates rON and − rOFF of the V1 layer silicon neuron of the ON channel (light gray) and of the OFF channel (dark gray), respectively. The input stimulus was a sinusoidal grating whose orientation and spatial frequency matched the peak frequency of the Gabor-like RF and its orientation preference; the temporal frequency was set to 3.16 Hz. The combined instantaneous firing rate r = rON − rOFF is shown in purple. Firing rates were mediated over ten recording sessions, solid lines represent the mean, whereas shadings represent standard deviation. d The comparison of the stimulus phase estimates for the ON-channel only (gray), the OFF-channel only (black), and their push-pull combination (purple). e The distributions around the means of the population errors of phase estimations, and of their reliability in terms of energy response for the three conditions considered. Solid dots depict the mean and associated error bars represent standard error of the mean. The minor bias in the error and the higher energy make the phase estimate by the push-pull configuration more accurate and reliable than those attainable by single channels. Color codes as in panel (c).

