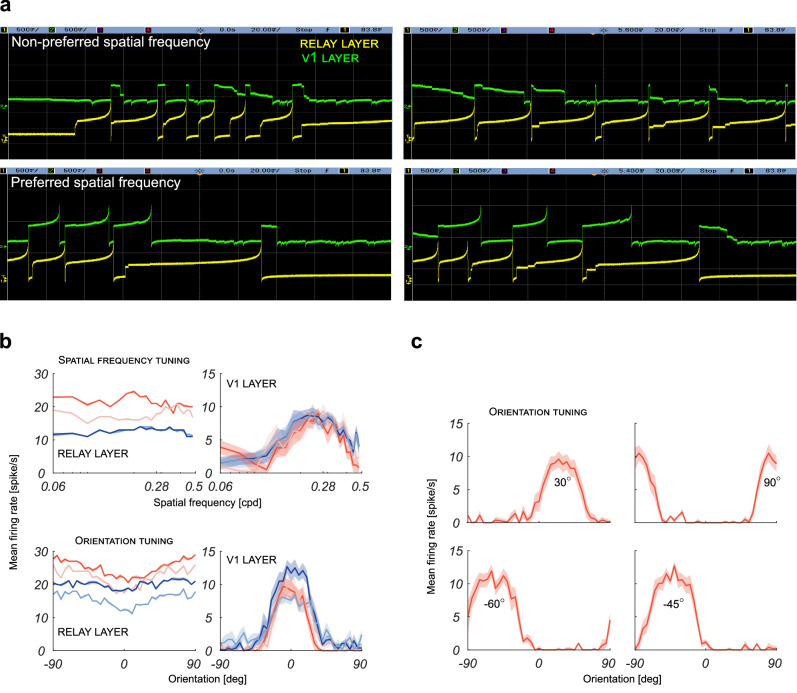
Fig. 8. Measured response properties of the implemented silicon neurons.
a Voltage traces of the membrane capacitor of the central neurons of the relay layer (yellow line) and V1 layer (green line). Panels exemplify how recurrent inhibition suppresses spike activity in case of stimuli with a non-preferred value for spatial frequency or orientation, and how the inhibitory effect is instead much weaker when stimuli with preferred spatial frequency or preferred orientation are presented. b The corresponding spatial frequency and orientation tuning curves in the relay layer and in the V1 layer. Tuning curves were mediated over ten recording sessions, solid lines represent the mean, whereas shadings represent standard deviation. The relay layer receives feed-forward input only, whereas the V1 layer receives also the contribution of recurrent inhibition. Different colors indicate different temporal frequencies of the gratings used as visual stimuli: 3.16 Hz (red), 2.15 Hz (light red), 1.45 Hz (blue), 1 Hz (lightsteelblue). c Tuning curves obtained by the measured responses of silicon neurons of the V1 layers with different orientation preferences, as indicated. The temporal frequency of the gratings used as visual stimuli was set to 3.16 Hz. As in panel b, solid lines represent the mean, whereas shadings represent standard deviation.

