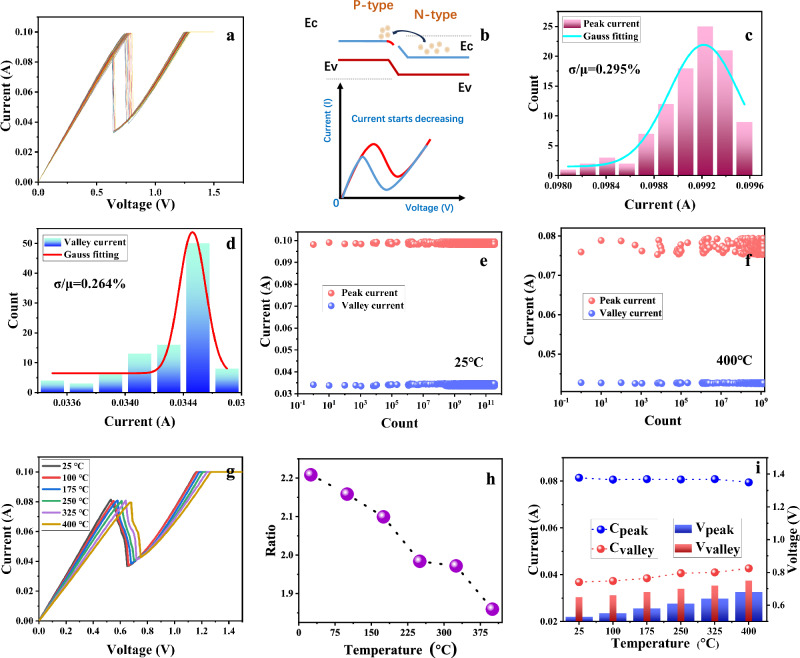
Fig. 3. Electrical performance measurement of devices.
a The 100 cycles of I–V characteristic curve of NDR device at room temperature. Illustrations are pictures of devices under an optical microscope. b The working mechanism of NDR memristor devices. c The peak current distribution histogram, blue line is a Gaussian fitting curve. d The valley current distribution histogram, the red line is a Gaussian fitting curve. e The NDR devices undergo more than 1011 switching cycles at room temperature. f The NDR devices undergo more than 109 switching cycles at 400 °C. g The illustration of single I–V curve at 25–400 °C. h The statistics of peak valley current ratio at different temperatures. i Statistics and change trend of peak current (valley current) and peak voltage (valley voltage) at 25–400 °C.

