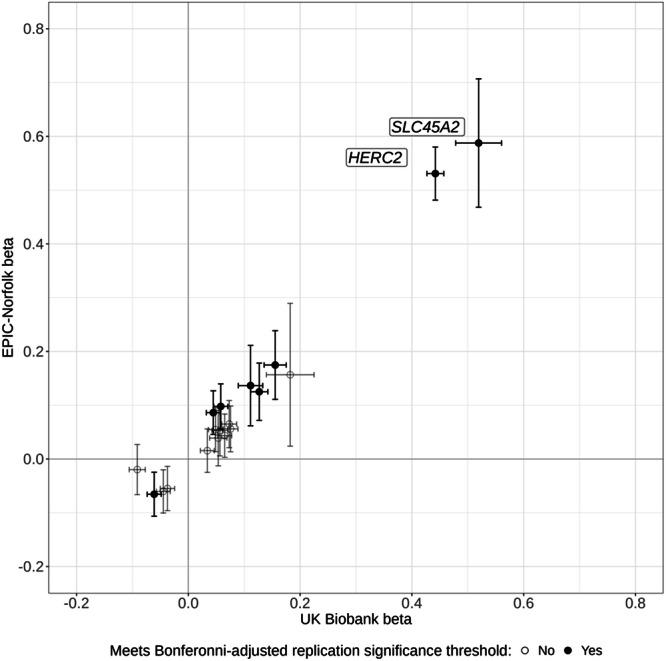
Fig. 4. Comparison of betas for lead variants identified from the discovery and replication cohort.

Comparison of betas expressed as change in standard deviation of mean RPS for lead variants identified from the discovery (UK Biobank, n = 37067) genome-wide association study (GWAS) with their corresponding betas in the replication (EPIC-Norfolk, n = 4273) analysis, with 95% confidence intervals. Betas in the cohort were calculated using a generalised linear mixed model, adjusting for age, sex and the first ten principal components. P-values are two-sided, calculated from the z-statistic and corrected for multiple comparisons. Variants meeting the Bonferroni-adjusted replication significance threshold (p = 0.05/ variants) in the EPIC-Norfolk GWAS are shaded black. The nearest gene is annotated for variants achieving genome-wide significance. Source data are provided as a Source Data file.
