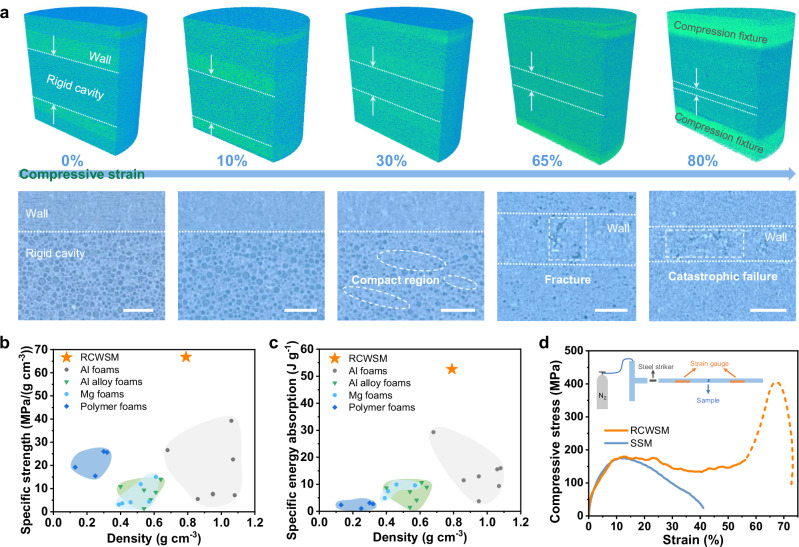
Fig. 4. Mechanism and performance for energy absorption of the RCWSM.
a Failure process of the RCWSM under static compression coupled with in situ X-ray microtomography. 3D reconstructions and corresponding cross-sections of the RCWSM under various compressive strains are shown to demonstrate the details of the failure process. Scale bar: 100 μm. b, c Ashby diagrams of specific strength versus density (b) and specific energy absorption versus density (c) for the RCWSM compared with those of typical energy absorption materials40–49. Dark blue region: polymer foams; light blue region: Mg foams; green region: Al alloy foams; gray region: Al foams. d Compressive stress-strain curves of the SSM and RCWSM for the split Hopkinson pressure bar (SHPB) test under a 6000 s−1 strain rate. The dashed line indicates that the integrity of the RCWSM has been destroyed, and the RCWSM has failed. Inset: schematic of the SHPB test.

