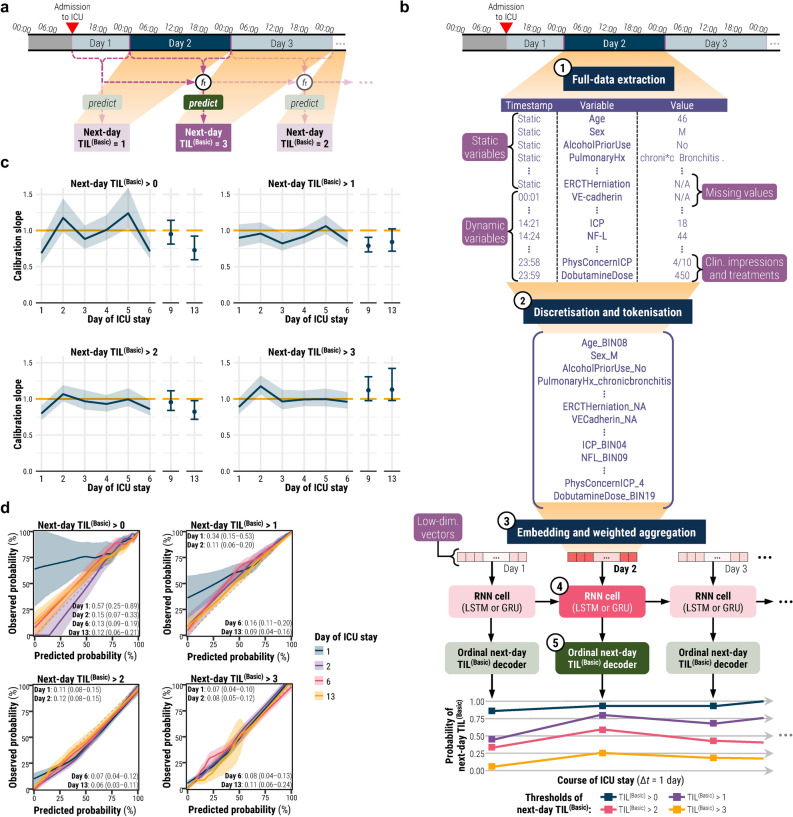
Fig. 1.
TILTomorrow prediction task and modelling strategy. All shaded regions surrounding curves are 95% confidence intervals derived using bias-corrected bootstrapping (1000 resamples) to represent the variation across the patient population and across the 20 repeated five-fold cross-validation partitions. (a) Illustration of the TILTomorrow dynamic prediction task on a sample patient’s timeline of ICU stay. The objective of the task is to predict the next-day TIL(Basic) score at each calendar day of a patient’s ICU stay. The prediction is dynamic, updated for each calendar day, and must account for temporal variation of variables across all preceding days using a time-series model (ft). (b) Illustration of the TILTomorrow modelling strategy on a sample patient’s timeline of ICU stay. Each patient’s ICU stay is first discretised into non-overlapping time windows, one for each calendar day. From each time window, values for up to 979 dynamic variables were combined with values for up to 1029 static variables to form the variable set. The variable values were converted to tokens by discretising numerical values into 20-quantile bins from the training set and removing special formatting from text-based entries. Through an embedding layer, a vector was learned for each token encountered in the training set, and tokens were replaced with these vectors. A positive relevance weight, also learned for each token, was used to weight-average the vectors of each calendar day into a single, low-dimensional vector. The sequence of low-dimensional vectors representing a patient’s ICU stay were fed into a gated recurrent neural network (RNN). The RNN outputs were then decoded at each time window into an ordinal prognosis of next-day TIL(Basic) score. The highest-intensity treatments associated with each threshold of TIL(Basic) are decoded in Table 1. (c) Probability calibration slope, at each threshold of next-day TIL(Basic), for models trained on the full variable set. The ideal calibration slope of one is marked with a horizontal orange line. (d) Ordinal probability calibration curves at four different days after ICU admission. The diagonal dashed line represents the line of perfect calibration. The values in each panel correspond to the maximum absolute error (95% confidence interval) between the curve and the perfect calibration line. Abbreviations: CT = computerised tomography, ER = emergency room, ft = time-series model, GRU = gated recurrent unit, Hx = history, ICP = intracranial pressure, ICU = intensive care unit, LSTM = long short-term memory, N/A = not available, NF-L = neurofilament light chain, SES = socioeconomic status, TIL = Therapy intensity level, TIL(Basic) = condensed, five-category TIL scale as defined in Table 1, VE = vascular endothelial.

