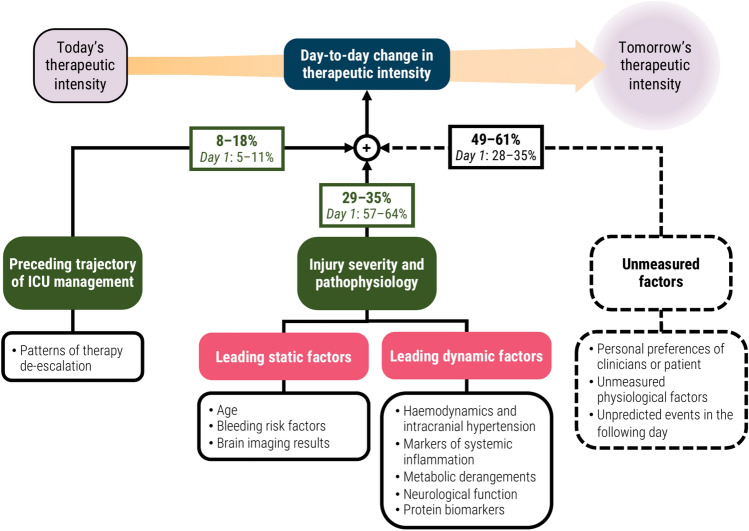
Fig. 5.
Conceptual diagram of factors explaining day-to-day changes in therapeutic intensity. The percentage values represent the differential explanation of ordinal variation in next-day changes in TIL(Basic) as measured by Somers’ Dxy. The bolded percentage values represent the 95% confidence interval of Somers’ Dxy from days 2–6 of ICU stay, whilst the percentage values below them represent the 95% confidence interval of Somers’ Dxy from day 1 of ICU stay (Fig. 3c). The 95% confidence intervals were derived using bias-corrected bootstrapping (1000 resamples) to represent the variation across 20 repeated five-fold cross-validation partitions. The leading static and dynamic pathophysiological factors were determined by qualitative categorisation of the variables with the highest contribution to next-day changes in TIL(Basic) based on ΔTimeSHAP values (Fig. 4). Abbreviations: TIL = therapy intensity Level, TIL(Basic) = condensed, five-category TIL scale as defined in Table 1.

