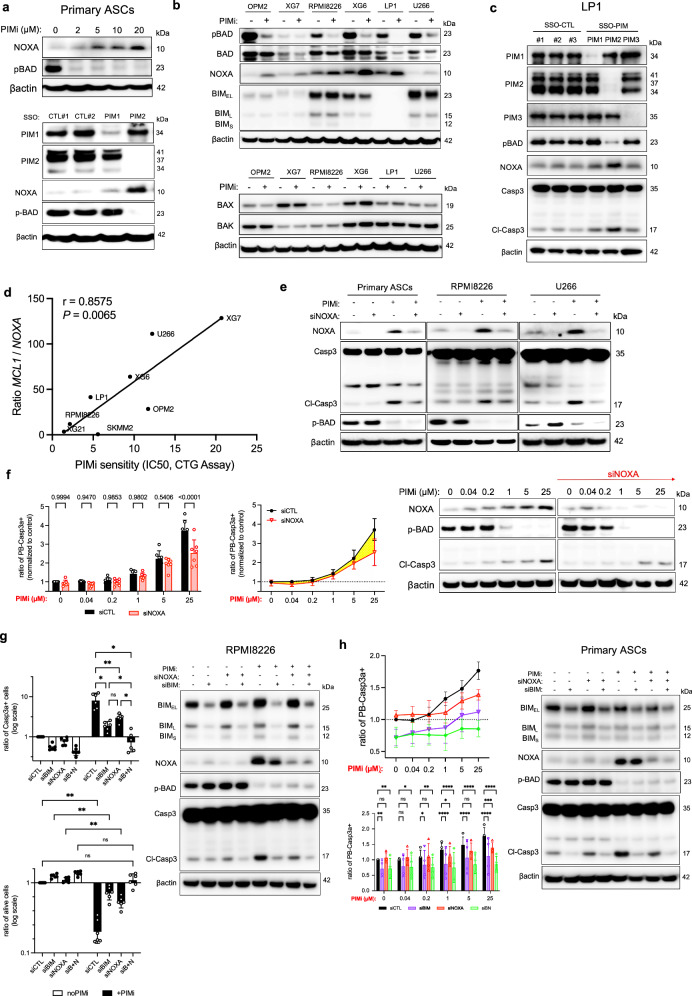
Fig. 2. PIM2 Inhibition Modulates pBAD and NOXA Expression.
a ASCs were treated with increasing doses of AZD1208 for 6 h or with SSO-PIM for 24 h. Protein levels were assessed by immunoblotting. The blot is representative of 2 independent experiments. b MMCLs were treated with AZD1208 for 24 h. Protein levels were assessed by immunoblotting. Samples were from the same experiment, with different gels processed parallel. The blot is representative of 2 independent experiments. c Cells were treated with SSO-PIM for 24 h. Protein levels were assessed by immunoblotting with different processed gels, including one for PIM1, PIM2, another for PIM3 and pBAD, and another for NOXA and Caspase 3. The blot is representative of 2 independent experiments. d Correlation analysis between MCL1/PMAIP1 expression ratio with AZD1208 IC50 values. e Cells were transfected with NOXA or control siRNA, and then treated with AZD1208 for 6 h. Protein levels were assessed by immunoblotting. The blot is representative of 2 independent experiments. f ASCs were transfected with NOXA or control siRNA, and then treated with increasing doses of AZD1208 for 6 h. Caspase 3-active ASCs were analyzed by flow cytometry. Data were normalized to the control. Data are shown as mean ± SD (n = 7). Protein levels were assessed by immunoblotting. The blot is representative of 2 independent experiments. g Cells were transfected with NOXA, BIM, BIM + NOXA (BN) siRNA, or control siRNA, and then treated with AZD1208 for 24 h. Caspase 3-active cells and cell viability were analyzed by flow cytometry. Data are shown as mean ± SD (n = 6). Protein levels were assessed by immunoblotting. The blot is representative of 2 independent experiments. h ASCs were transfected with NOXA, BIM, BIM + NOXA (BN) or control siRNA, and then treated with AZD1208 for 6 h. Caspase 3-active ASCs were analyzed by flow cytometry. Data are shown as mean ± SD (n = 4). Protein levels were assessed by immunoblotting, with different processed gels, including one for NOXA, pBAD, and BIM, and another for Caspase 3. The blot is representative of 2 independent experiments. P-values were calculated using Pearson’s test (two-tailed) with linear regression for (d), two-way ANOVA with Holm-Sidak’s adjustment for (f), two-way ANOVA with Tukey adjustment for (f) and (g), and two-way ANOVA with Dunnett adjustment for (h). P < 0.05 is indicated as *P < 0.01 as **P < 0.001 as *** and P < 0.0001 as ****. Exact p-values are indicated in the Source Data file. “n”, denotes the number of biological replicates. Source data are provided as a Source Data file. ASCs, antibody-secreting cells; PIMi, pan-PIM inhibitor AZD1208; CTL, control; MMCLs, multiple myeloma cell lines; SSO, splice-switching oligonucleotide.

