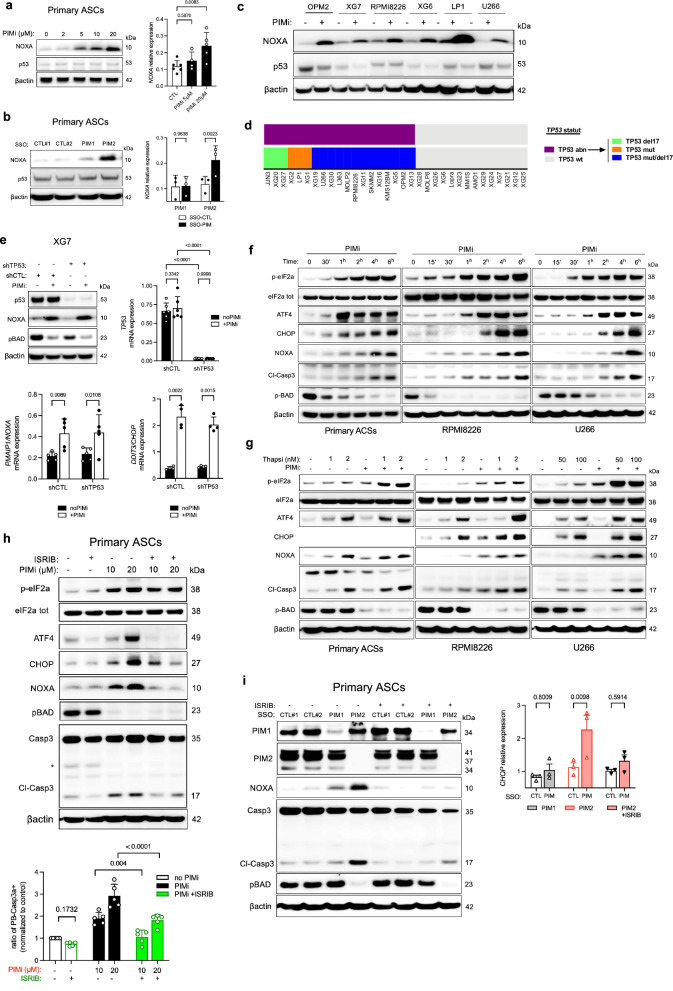
Fig. 3. Impact of PIM2 Inhibition on ISR Activation and Apoptosis.
a ASCs were treated with increasing doses of AZD1208 for 6 h. Protein levels were assessed by immunoblotting. mRNA expression was assessed by qPCR. Data are shown as mean ± SD (CTL, n = 6; PIMi 5 µM, n = 4; PIMi 20 µM, n = 5). b ASCs were treated with SSO-PIM for 24 h. mRNA expression was assessed by qPCR. Data are shown as mean ± SD (n = 3). c MMCLs were treated with AZD1208 for 24 h. Protein levels were assessed by immunoblotting. The blot is representative of 2 independent experiments. d TP53 mutational and deletion status in 33 MMCLs identifying three TP53 abnormal (TP53 abn) profiles. Cell lines without abnormalities were classified as wild type (TP53 wt). e shTP53 XG7 cells were treated with AZD1208 for 8 h. Protein expression was assessed by immunoblotting. mRNA expression assessed by qPCR. Data are shown as mean ± SD (TP53, n = 6; PMAIP1, n = 5; DDIT3, n = 4). f Cells were treated with AZD1208 and harvest at different time points. Protein levels were assessed by immunoblotting. All markers were processed on the same gel, except for p-BAD processed on a different gel. The blot is representative of 2 independent experiments. g Cells were treated with AZD1208 for 2 h, followed by thapsigargin for 4 h. Protein levels were assessed by immunoblotting. The blot is representative of 2 independent experiments. h ASCs were pre-treated with ISRIB before adding AZD1208 for 6 h. Protein levels were assessed by immunoblotting. Caspase 3-active ASCs were analyzed by flow cytometry. Data were normalized to the control condition. Data are shown mean ± SD (n = 5). i ASCs were pretreated with ISRIB for 2 h followed by SSO-PIM treatment. Protein levels were assessed by immunoblotting and mRNA expression was assessed by qPCR. Data are mean ± SEM (n = 3). P-values were calculated using one-way ANOVA with Dunnett’s adjustment for (a), and two-way ANOVA with Sidak’s adjustment for (b), (h), and (i), and for (e). “n”, denotes the number of biological replicates. Source data are provided as a Source Data file. ASCs, antibody-secreting cells; PIMi, pan-PIM inhibitor AZD1208; Thapsi, thapsigargin; MMCLs, multiple myeloma cell lines; SSO, splice-switching oligonucleotide.

