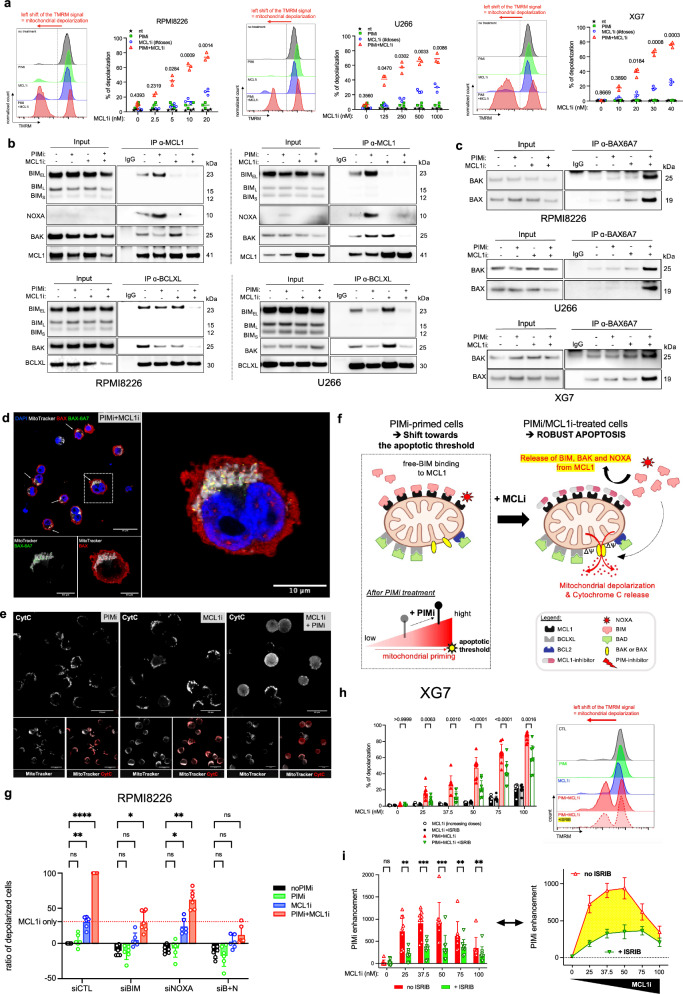
Fig. 5. PIM2 Inhibition Heightens MCL1 Inhibitor Sensitivity via NOXA Expression.
a Cells were pretreated with AZD1208 before adding increasing doses of MCL1 inhibitor. Percentage of depolarized cells were analyzed by flow cytometry. Data are shown as mean (n = 3). b Cells were pretreated with AZD1208 before adding increasing doses of MCL1 inhibitor. Immunoprecipitation of MCL1 and BCL-XL assessed their interaction with BIM, NOXA, BAK, MCL1, and BCL-XL. The input for RPMI8226 is the same as for RPMI8226 in Fig. 4f, because the cells for IP were from the same experiments. The blot is representative of 1 independent experiment. c Cells were pretreated with AZD1208 before adding increasing doses of MCL1 inhibitor. Immunoprecipitation of BAX-6A7 (BAX active) evaluated its interaction with BAK. The blot is representative of 1 independent experiment. d Cells were pretreated with AZD1208 before adding increasing doses of MCL1 inhibitor. Immunofluorescence of full-length of BAX (red), activated BAX (BAX 6A7; green) and mitochondria (MitoTracker dye; white). Provided images are representative of 3 images. e Cells were pretreated with AZD1208 before adding increasing doses of MCL1 inhibitor. Immunofluorescence of Cytochrome c (red) and mitochondria (MitoTracker dye; white). Provided images are representative of 3 images. f Schematic Illustration: PIM inhibition prevents reuptake of BIM and BAK by BCL-XL after MCL1 inhibition, leading to BAX activation and mitochondrial depolarization. Created with BioRender.com. g RPMI8226 cells were transfected with NOXA, BIM, BIM + NOXA siRNA or control siRNA, then treated with AZD1208 before adding increasing doses of MCL1 inhibitor. The percentage of depolarized cells was analyzed by flow cytometry. Data are shown as mean +/− SEM (n = 6). h Cells were treated with AZD1208 overnight in the presence or absence of ISRIB before adding MCL1 inhibitor. Percentage of depolarized cells were analyzed by flow cytometry. Data are shown as mean +/− SEM (n = 7). i Enhancement of depolarization by PIM inhibitor was assessed by normalizing depolarization levels after combined PIMi/MCL1i treatment to those with PIM inhibitor alone, with or without ISRIB. Data are shown as mean ± SEM (n = 7). P-values were calculated using two-way ANOVA with Sidak’s adjustment for (a), (h), and (i), and two-way ANOVA with Tukey’s adjustment for (g). P < 0.05 is indicated as *P < 0.01 as **P < 0.001 as ***P < 0.0001 as ****. Exact p-values are indicated in the Source Data file. “n”, denotes the number of biological replicates. Source data are provided as a Source Data file. ASCs, antibody-secreting cells; PIMi, pan-PIM inhibitor AZD1208; MCL1i, MCL1 inhibitor AZD5991; BN, BIM + NOXA.

