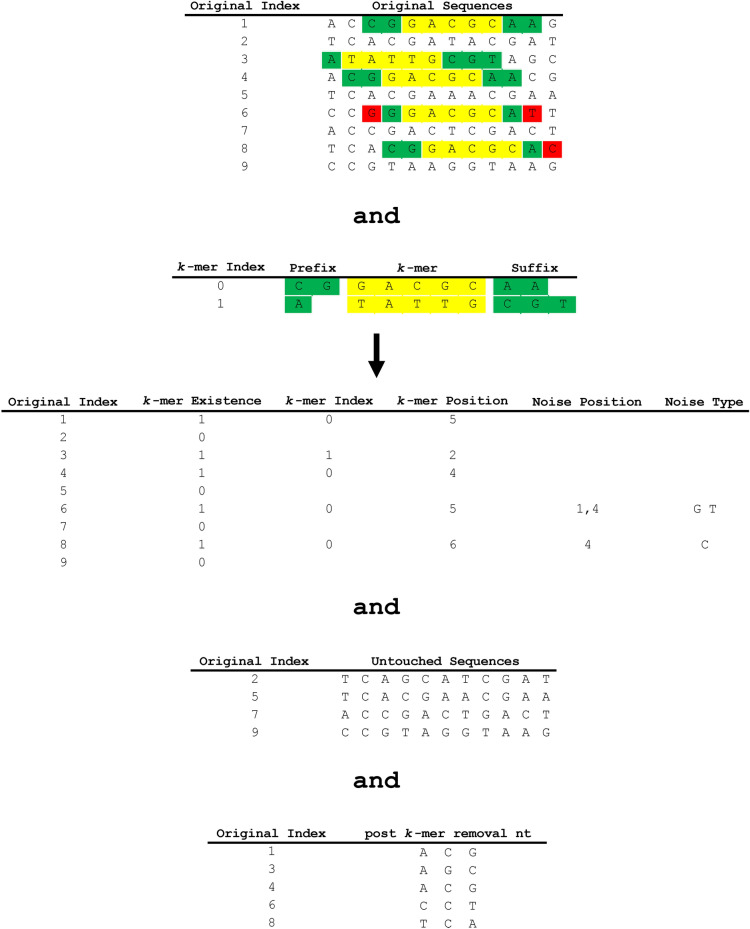
Fig. 6.
GeneSqueeze k-mer removal process. An example of the k-mer removal process is depicted, illustrating the identification and encoding of k-mers, as well as the outcome for sequences that contain no k-mers (untouched sequences) or mismatches (post k-mer removal nt). The initial array shows the original indices and original sequences, with the k-mers highlighted in yellow, the prefixes and suffixes highlighted in green, and noise highlighted in red. The second array illustrates the k-mer dictionary. The third table illustrates the presence or absence of k-mers in each sequence, as well as the position and type of any noise detected in each sequence.

