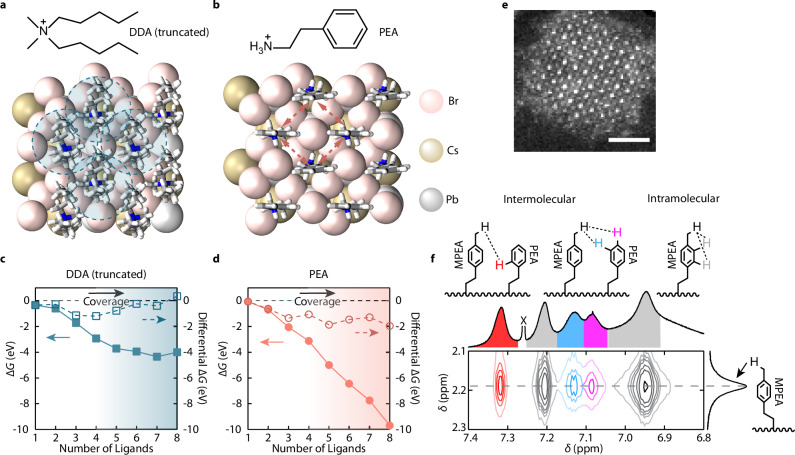
Fig. 1. Free energies of ligand-covered CsPbBr3 QD surfaces and intermolecular interactions of PEA ligands.
a, b Slabs of CsPbBr3 fully passivated with a DDA (truncated) and b PEA used in DFT calculations. The shaded circles in a indicate the intermolecular steric repulsions, while the dashed arrows in b indicate the intermolecular π-π stacking interactions. c, d Calculated surface free energies (solid marks) and differential free energies (hollow marks) as a function of the numbers of surface-bound c truncated DDA and d PEA ligands. ΔG represents free energy. The shadings indicate the ligand density. e STEM image of a strongly confined CsPbBr3 QD exhibiting cuboidal shape, exposing mostly the (100) facets. The scale bar represents a length of 2 nm. f Expanded region of the solution NOESY spectrum shows QDs ligand-exchanged with mixed ligands containing PEABr and MPEABr, measured at 60 °C. δ represents chemical shift. The intermolecular (red, blue and purple) and intramolecular (gray) proton nOe correlations between PEA moieties on the QD surface are colored in both the schemes and the spectrum. The peak (partially unshown) marked by X is the chloroform solvent residue. The full spectrum is provided in Supplementary Fig. 11.

