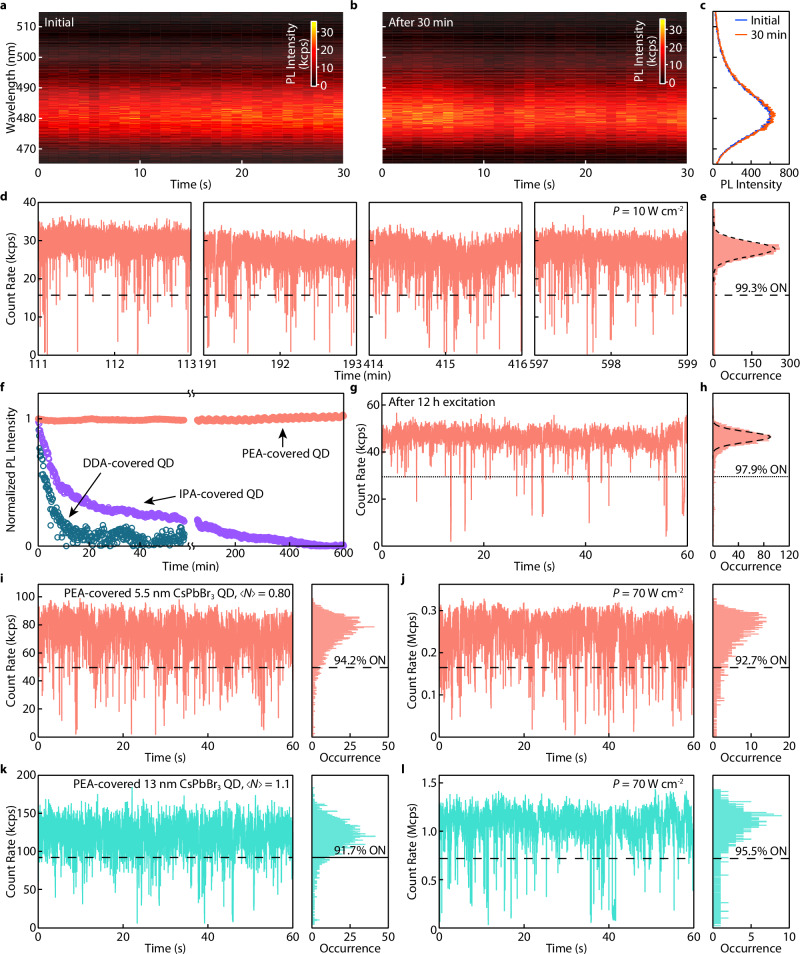
Fig. 4. Spectral stability and resistance to photodarkening of PEA-covered CsPbBr3 QDs.
a, b Time-resolved PL spectra of a single CsPbBr3 QD (~4.1 nm) a before and b after 30 min of continuous laser excitations (cw mode, 42 W cm−2). c Integrated PL spectra from (a, b). The superimposed spectra showed no spectral shifting over 30 min of excitation. d Representative PL blinking trace segments extracted at different times of a single PEA-covered QD (~5.5 nm) continuously measured over 10 h (10 W cm−2). e The PL intensity distribution histogram extracted from the last segment in d, showing the QD remained nearly non-blinking during the measurement. f Normalized PL intensity of a collection of PEA-covered CsPbBr3 QDs (red) under 10 h of continuous laser excitation. In contrast, DDA-covered QDs (blue) and IPA-covered QDs (purple) were significantly photodarkened (50% of the initial PL intensity) in the first 3 min and 10 min of operation, respectively. g PL blinking trace and h, intensity distribution histogram of a single PEA-covered QD in f after 12 h of continuous operation. i–l PL blinking traces and PL intensity distribution histograms for two PEA-covered CsPbBr3 QDs (i, j 5.5 nm and k, l, 13 nm), under intense laser excitation (i, k, pulsed mode, 2 MHz repetition rate, j, l, cw, excitation densities are noted in the figures), exhibiting very high count rates and >90% ON time fraction. All blinking traces were built using a bin time of 10 ms. The unit kcps represents kilo-counts per second, and the unit Mcps represents mega-counts per second.

