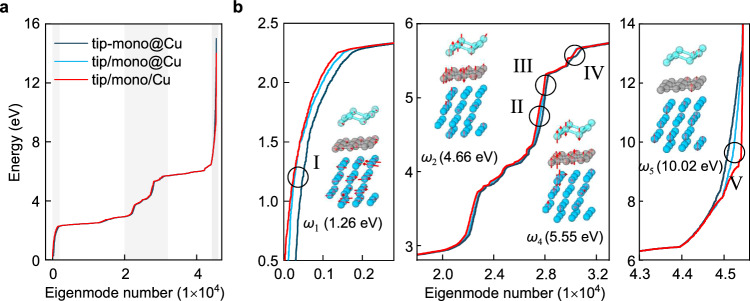
Fig. 4. MBD oscillation modes of charge density fluctuations.
a Energy spectrum for the coupled tip-graphene-Cu tri-layer (tip-mono@Cu), plotted in ascending order. The combined spectrum of isolated tip and Cu-supported graphene (tip/mono@Cu), and the combined spectrum of isolated tip, isolated graphene and isolated Cu (tip/mono/Cu) are presented for comparison. The shaded areas in a correspond to the zoomed panels in b. b Zoomed spectra for the shadowed regions in a, and illustrations of coupled modes evidently shifted from corresponding uncoupled modes. The red arrows represent the dipole displacements of the atoms. Hydrogen atoms with minute dipole displacements are hidden for clarity.

