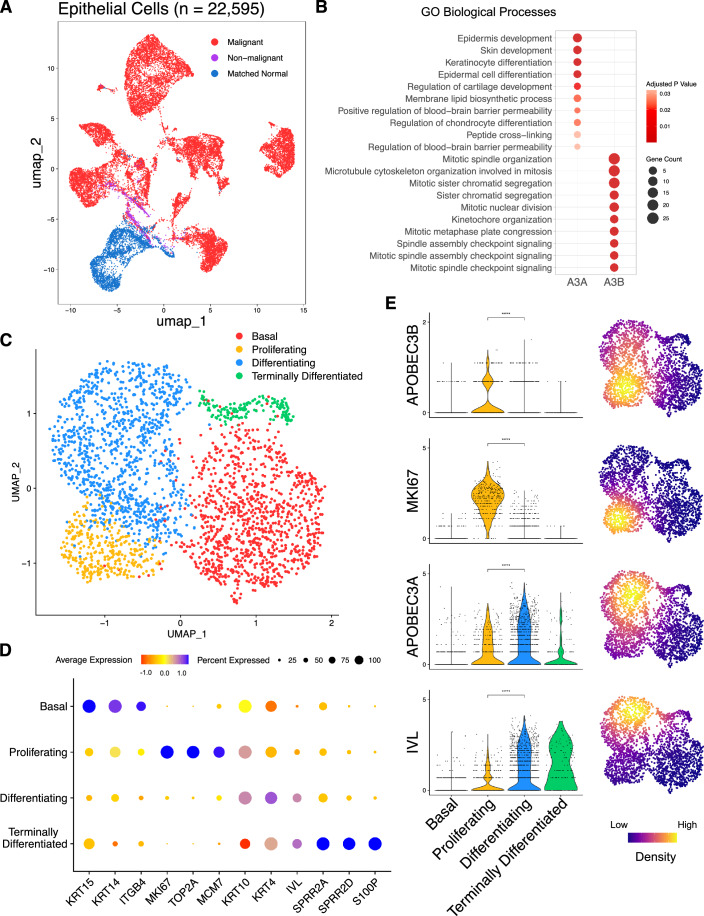
Figure 2. APOBEC3A and APOBEC3B are expressed in different subsets of tonsillar epithelial cells.
(A) UMAP projection of 22,595 epithelial cells from oropharyngeal squamous cell carcinoma samples (n = 10; 18,619 malignant cells (red), 695 non-malignant cells (purple)), and matched normal tonsil (n = 7; 3281 cells (blue)). (B) GOBP terms enriched amongst the sets of 100 genes that were co-expressed with either APOBEC3A or APOBEC3B in 2649 (after QC) epithelial cells from normal tonsil. Terms ranked by P value calculated by EnrichR package (Fisher Exact test bias corrected using the z-score of the deviation from the expected rank). (C) UMAP projection depicting four phenotypes (basal, proliferating, differentiating, terminally differentiated) displayed by the normal tonsillar epithelial cells in our dataset. (D) Marker genes are used to identify the four epithelial phenotypes represented in (C). (E) Violin plots of gene expression in individual tonsillar epithelial cells, and UMAP projections of the density of gene expression in the tonsillar epithelial subtypes. (****P < 0.0001, Wilcoxon’s rank-sum test; Basal, n = 1047; Proliferating, n = 353; Differentiating, n = 1091; Terminally differentiated, n = 158).

