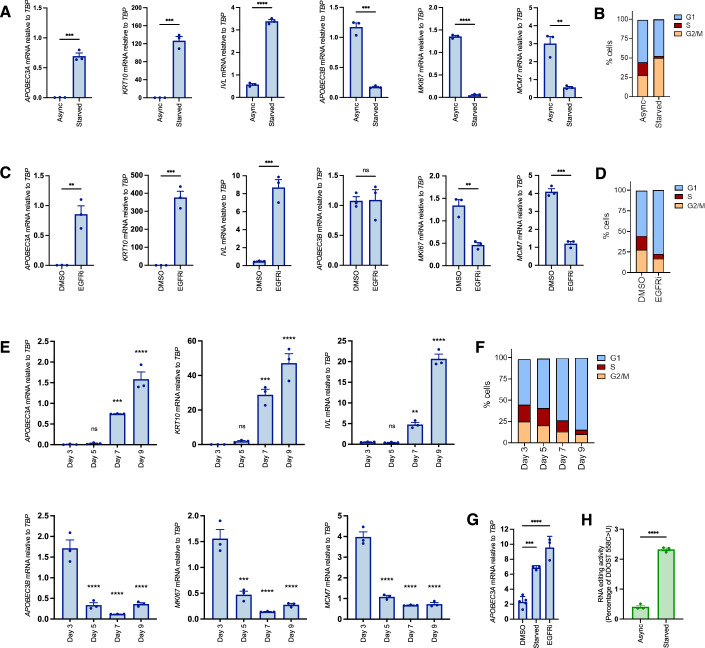
Figure 3. Keratinocyte cell cycle exit and initiation of differentiation is marked by a switch from APOBEC3B to APOBEC3A expression.
(A) qRT-PCR-based gene expression measurements (n = 3) for APOBEC3A (P = 0.0002), KRT10 (P = 0.0002), IVL (P < 0.0001), APOBEC3B (P = 0.0001), MKI67 (P < 0.0001) and MCM7 (P = 0.0033) in proliferating NIKS (Async) or following 48 h of growth factor deprivation (Starved). (B) Representative cell cycle profiles of Async and starved NIKS measured by PI staining and flow cytometry. (C) qRT-PCR-based gene expression measurements (n = 3) for APOBEC3A (P = 0.0036), KRT10 (P = 0.0004), IVL (P = 0.0007), APOBEC3B (P = 0.9445), MKI67 (P = 0.0032) and MCM7 (P = 0.0001) following 24 h of vehicle control (DMSO) or 100 nM afatinib treatment (EGFRi). (D) Representative cell cycle profiles of DMSO and afatinib-treated NIKS measured by PI staining and flow cytometry. (E) qRT-PCR-based gene expression measurements (n = 3) for APOBEC3A (adjusted P values versus day 3 measurement: day 5 = 0.9960; day 7 = 0.0009; day 9 <0.0001), KRT10 (adjusted P values versus day 3 measurement: day 5 = 0.9518; day 7 = 0.0005; day 9 <0.0001), IVL (adjusted P values versus day 3 measurement: day 5 = 0.9983; day 7 = 0.0035; day 9 <0.0001), APOBEC3B (adjusted P values versus day 3 measurement: day 5 <0.0001; day 7 <0.0001; day 9 <0.0001), MKI67 (adjusted P values versus day 3 measurement: day 5 = 0.0001; day 7 <0.0001; day 9 <0.0001) and MCM7 (adjusted P values versus day 3 measurement: day 5 <0.0001; day 7 <0.0001; day 9 <0.0001) in NIKS collected 3, 5, 7, or 9 days after plating. (F) Representative cell cycle profiles of NIKS collected 3, 5, 7, or 9 days after plating were measured by PI staining and flow cytometry. (G) qRT-PCR measurements of APOBEC3A expression in primary human epidermal keratinocytes (NHEK) growing in FC medium and treated for 24 h with vehicle control (DMSO) or 100 nM afatinib (EGFRi, P < 0.0001) or following growth factor deprivation for 48 h (Starved, P = 0.0003). (H) Percentage of DDOST transcripts that were C > U edited at c558 in asynchronous growing NIKS (Async) and following 48 h of growth factor withdrawal (starved) measured by digital PCR assay (n = 3; P < 0.0001). Error bars = SEM. *P < 0.05; **P < 0.01; ***P < 0.001; ****P < 0.0001. Pairwise comparisons were performed using unpaired two-tailed t-tests in (A, C, H). Comparisons of mRNA levels on days 5, 7 and 9 to day 3 in (E), and of mRNA levels in starved and afatinib-treated cells to DMSO-treated cells in (G) were performed using one-way ANOVA with Dunnett’s multiple comparisons test. Source data are available online for this figure.

