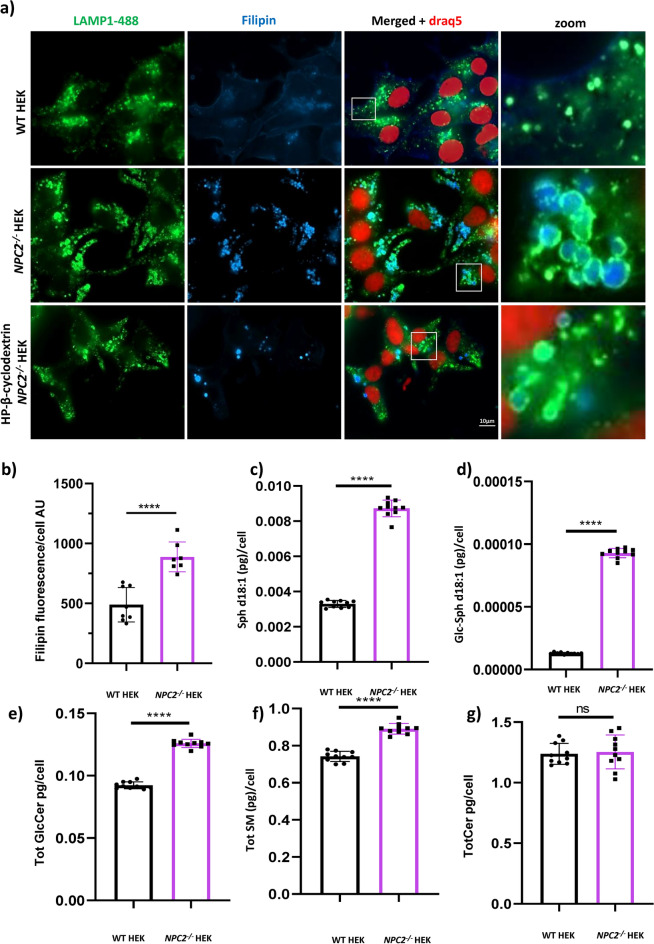
Fig. 2.
Lipid dyshomeostasis in NPC2−/− HEKs. a Representative epifluorescence images of untreated WT HEKs, NPC2−/− HEKs and HP-β-cyclodextrin treated NPC2−/− HEKs, labelled with the fluorescent probe filipin (blue) to mark free cholesterol, DRAQ5-647 (red) to stain the nucleus and an antibody to LAMP1 to mark the late endosomal/lysosomal membrane (green). Insets (bottom row) show late endosomes of the NPC2−/− HEKs co-stained with LAMP1 and filipin (unesterified cholesterol) whereas no filipin is detectable in late endosomes of WT HEK. b Quantification of the filipin fluorescence intensity (unesterified cholesterol) detected in WT andNPC2−/− HEKs. AU = arbitrary units c–g Mass spectrometry quantitation of the levels of: c Sphingosine (Sph d18:1); d Glucosylsphingosine (GlcSph d18:1); e Total Glucosylceramide (sum of GlcCer chain length species d16:0, d18:0, d20:0, d22:0, d24:0, d24:1); f Total Sphingomyelin (sum of SM chain length species d16:0, d18:0, d20:0, d22:0, d24:0, d24:1) and g Total Ceramide (sum of Cer chain length species d16:0, d18:0, d20:0, d22:0, d24:0, d24:1) in WT and NPC2−/− HEKs. Mass- spec data are reported as pg/cell and expressed as mean +/- standard deviation (SD). ****p < 0.0001; **p < 0.01; ns = not significant. p values were calculated with the Student’s T test. Each dot of the graphs indicates a technical replicate (10) replicates used.

