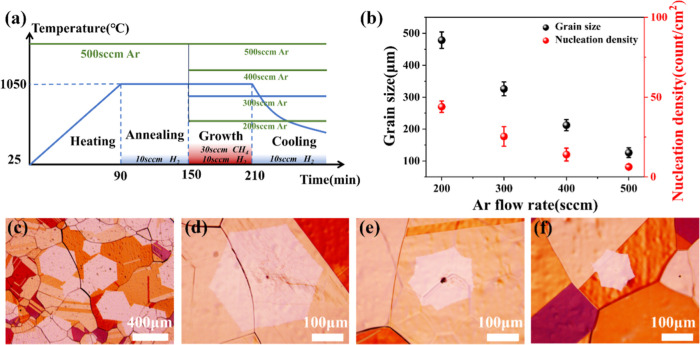
Figure 5.
(a) Schematic diagram of the graphene growth process including temperature and gas flow over time. (b) Graphene nucleation density and grain size under four different Ar flow rates (three reduplicate experimental results contained under each Ar flow rate condition). (c–f) OM images of graphene domains grown on Cu substrates corresponding to Ar fluxes of 200, 300, 400, and 500 sccm, respectively.

