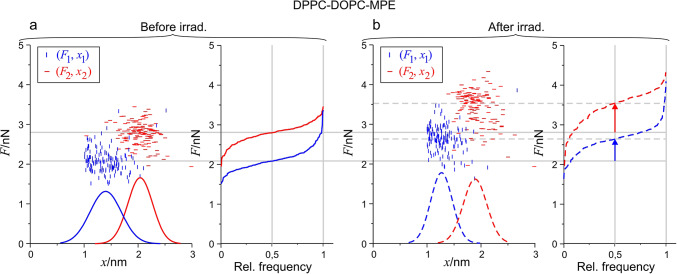
Fig. 5.
Scatterplot and distribution of (F, x) data of the 1st and 2nd rupture events before and after irradiation for DPPC-DOPC-MPE SLB. (a) 2D maps of the distribution with fitted Gaussian density functions along the horizontal (x) axis. 1st rupture events are represented with blue, 2nd rupture events are represented with red, and the cumulative distribution of F1 and F2 are with the same color coding. (b) The same representation for the curves after irradiation the fitted curves are displayed with dashed lines. The arrows present the shift in the median F1 and F2 force due to irradiation.

