Fig. 4.
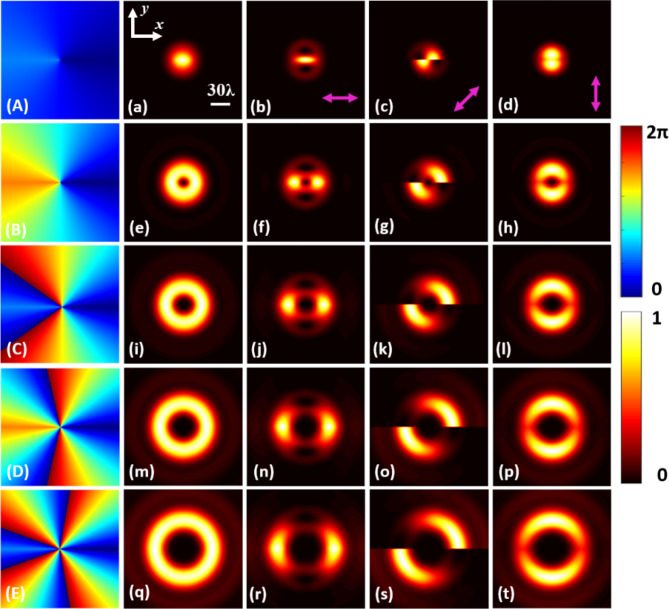
Light intensity diagram under different TC with 0.5-order vector polarization. Subgraphs (a, e, i, m, q) are vector vortex beams generated with 0.5-order vector polarization, (a) l = ± 0.5, (e) l = ± 1.5, (i) l = ± 2.5, (m) l = ± 3.5, (q) l = ± 4.5, which created by phase encoded in P-SLM (A, B, C, D, E). The subgraph (b-d, f-h, j-l, n-p, r-t) shows the light intensity of the vector vortex beams (a, e, i, m, q) passing through the polarizer with purple arrows. The light intensities are normalized to a unit value, and the phase scale is 0–2π.

