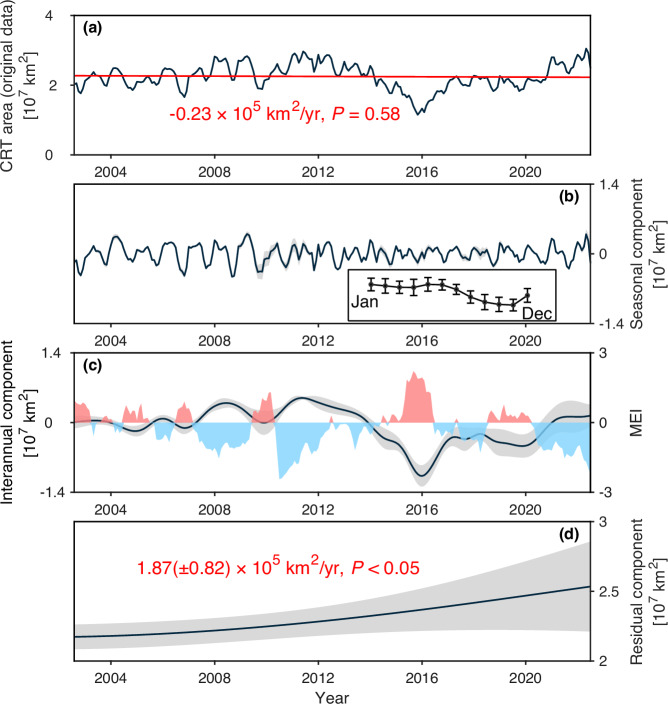
Fig. 2. Decomposition of the monthly time series of the chlorophyll-rich tongue (CRT) area using empirical mode decomposition (EMD).
a The original 20-year monthly time series of the CRT area (the solid black line), its linear fitting trend (solid red line), and its decomposition into (b) seasonal, (c) interannual, and (d) residual components. Variabilities of high-frequency (< 2 year) were combined as the seasonal component; the components of low-frequency (> 8 years) were combined into the interannual component, because the 20-year time span of the CRT area time series inhibits the decomposition of decadal variability with physical meaning. The seasonal pattern of the CRT area is inserted in (b), with the solid line and error bar representing the mean CRT area and the standard deviation of each month, respectively. The temporal variation of the Multivariate ENSO Index (MEI) is also included in (c), with the red and blue shadings indicating El Niño and La Niña, respectively. The gray shading represents a range of two standard deviations, equivalent to a 95% confidence limit (see “Methods”).

