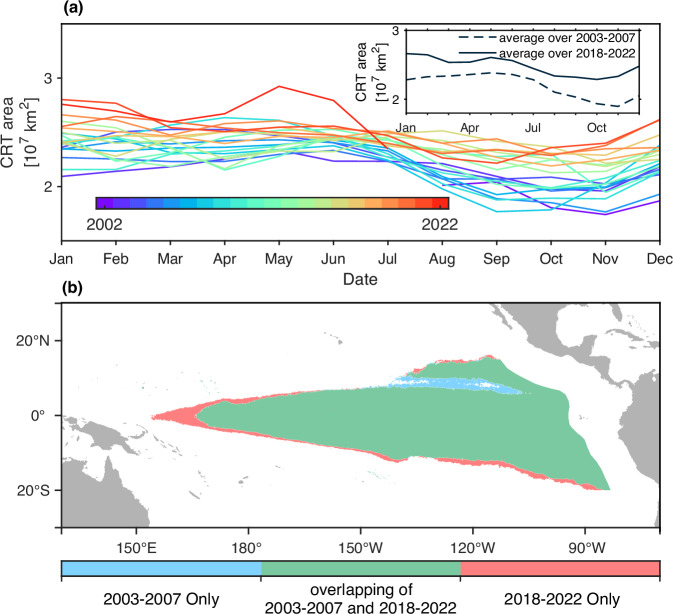
Fig. 4. Illustration of the westward extension of the chlorophyll-rich tongue (CRT).
a Evolution of the monthly CRT area from 2002 to 2022. The insert figure in (a) shows the comparison between the average annual cycle in 2003–2007 (the black dashed line) and that in 2018–2022 (the solid black line). b Comparison of the average CRT extent between the first (2003–2007, light blue patches) and the last five years (2018–2022, magenta patches) of the investigated period. Green areas represent the overlapped CRT extent in these two periods.

