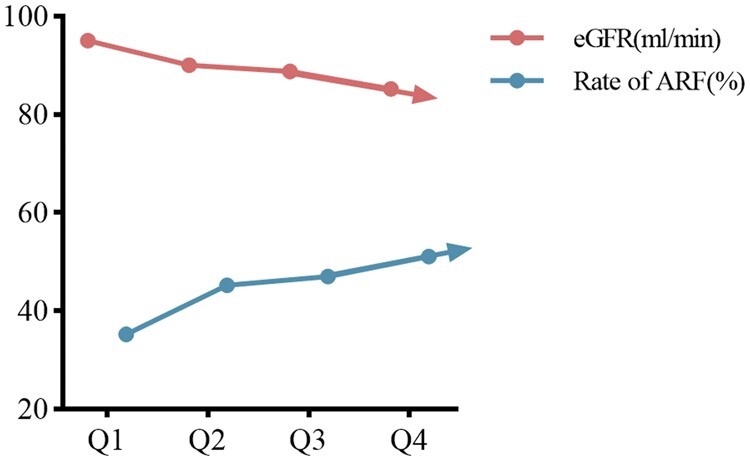
Figure 4.

Proportion of abnormal renal function (ARF) at different serum urate levels and trend plot of mean eGFR level. The proportion of ARF increases with serum urate levels. Rate of ARF: proportion of abnormal renal function; eGFR: estimated glomerular filtration rate
