. 2024 Dec 18. Online ahead of print. doi: 10.1039/d4mr00098f

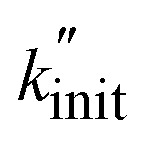
Fig. 2. Variation of milling frequency and sphere number. (A) Propene flow during milling of 2 g model PP at 25–35 Hz with 5 ZrO2 grinding spheres (10 mm diameter). (B) Cumulative C1–3 hydrocarbon yields obtained after 1 h of milling 2 g model PP at 25–35 Hz with 5 ZrO2 grinding spheres (10 mm diameter). (C) Cumulative total C1–3 hydrocarbon yields (Ytotal) obtained after 1 h of milling 2 g model PP at 25–35 Hz with 5 ZrO2 grinding spheres (10 mm diameter), and fit (Ytotalfmill5.51). (D) Dependency of hydrocarbon formation on fmill: exponent xi obtained by fitting Yi per mg ∝ (fmill per Hz)xi for each product i. Yi denotes the cumulative yield of i after 1 h with 5 ZrO2 grinding spheres (10 mm diameter) at fmill = 25–35 Hz. (E) Inline graphic as a measure for chain cleavage calculated from experimental data viaeqn (15) plotted against milling frequency fmill together with fit (gray line) using the modified Zhurkov equation (eqn (16)). (F) Propene flow during milling of 2 g model PP at 30 Hz with 3–19 ZrO2 grinding spheres (10 mm diameter).
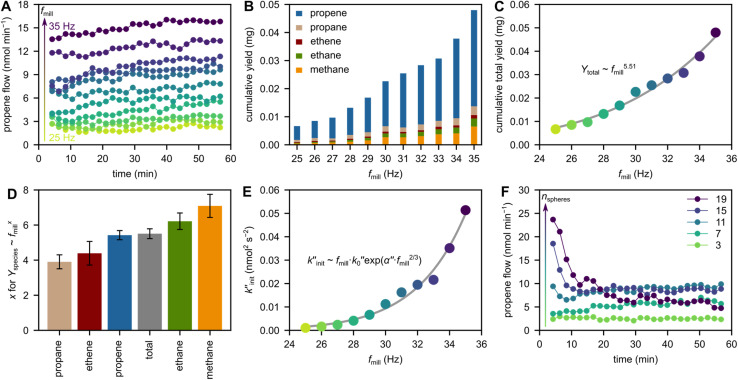
Fig. 2