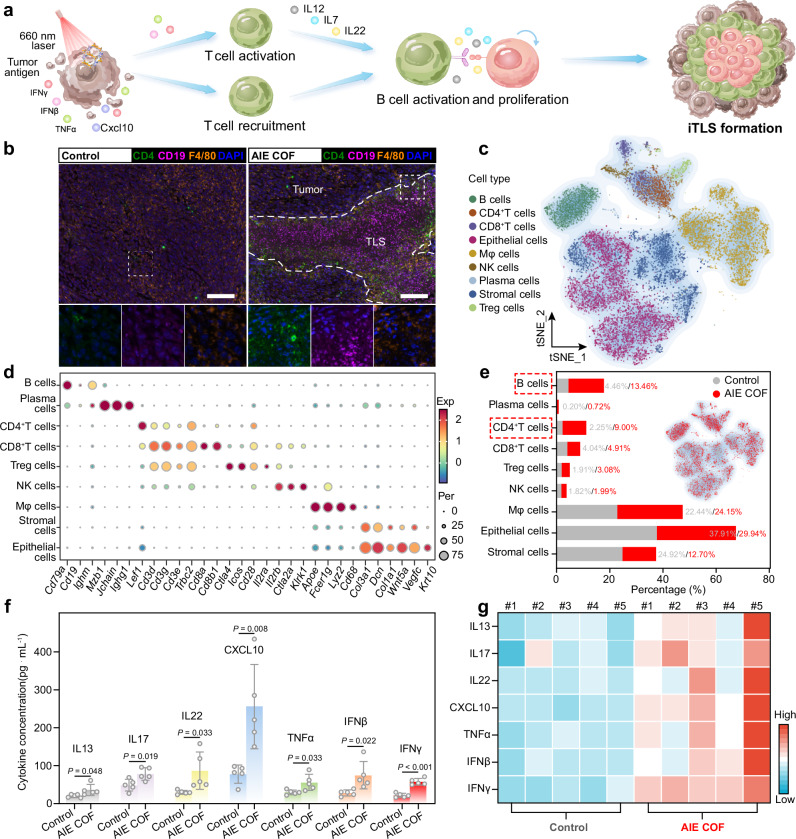
Fig. 6. TPDA-ViBT-COF-meditated phototherapy for inducing TLS formation.
a Schematic illustration of the occurrence of TLS formation triggered by TPDA-ViBT-COF-meditated phototherapy. b Representative images of mIHC staining of CD4 (green), CD19 (magenta), F4/80 (yellow), and DAPI (blue) in MC38 tumor after and before TPDA-ViBT-COF treatment, scale bar: 50 µm. Data were repeated 4 times independently with similar results. c t-Distributed stochastic neighbor embedding plots of 17182 cells from MC38 tumor treatment with TPDA-ViBT-COF-meditated phototherapy. d A dot plot was generated to display the highly expressed marker genes in each major cell type. e A stacked histogram was employed to depict the percentages of different cell types among total cells, with or without TPDA-ViBT-COF treatment. f Quantification of the levels of various cytokines and chemokines in tumors following treatment with control or TPDA-ViBT-COF, n = 5 independent samples, data are presented as mean ± SEM and statistical significance was assessed using two-tailed Student’s t-test, PG(IFNγ) = 0.0003. g A heat map was generated to visualize the distribution of IL13, IL17, IL22, CXCL10, TNFα, IFNβ, and IFNγ levels within each tumor, n = 5 independent samples. Source data are provided as a Source Data file.

