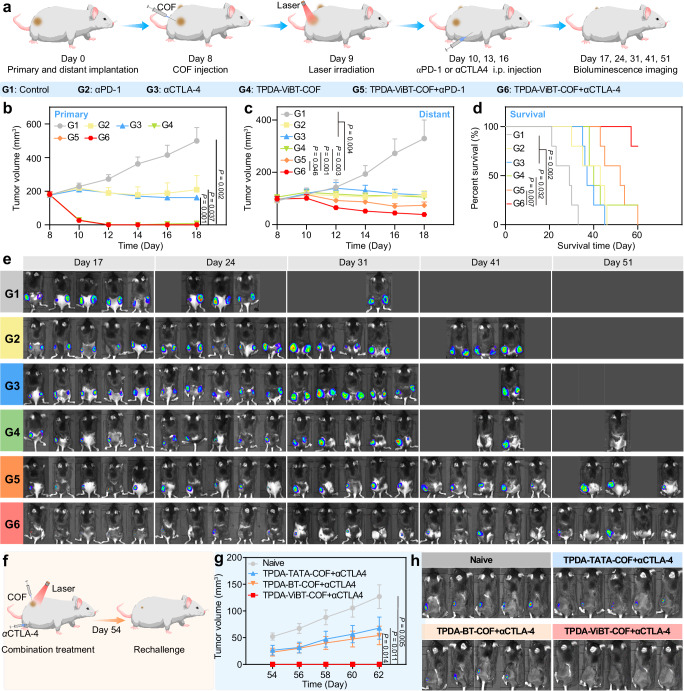
Fig. 9. TPDA-ViBT-COF-mediated ICB.
a Schematic illustration of the combination therapy of TPDA-ViBT-COF + αCTLA4. The tumor growth curves of primary (b) and distant (c) and the percentage of survival (d) among MC38 mice following various treatments, n = 5 independent samples. e Bioimages of MC38 mice following various treatments. f The treatment protocol of rechallenge experiments. g The growth curve of tumors in the control, TPDA-TDTA-COF + αCTLA4, TPDA-BT-COF + αCTLA4, and TPDA-ViBT-COF + αCTLA4, n = 6 independent samples. h Bioluminescence images of mice in the naïve, TPDA-TDTA-COF + αCTLA4, TPDA-BT-COF + αCTLA4, and TPDA-ViBT-COF + αCTLA4, n = 5 independent samples. Data in this study are presented as mean ± SEM and statistical significance was determined by performing one-way ANOVA with the post hoc Tukey test used when comparing more than two groups. Survival analysis was conducted using the log-rank Mantel-Cox test. Source data are provided as a Source Dat a file.

