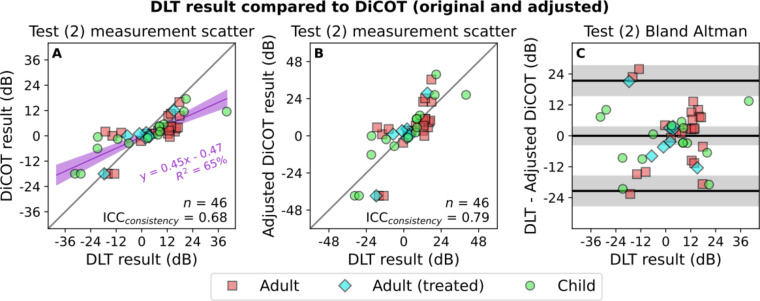
Fig. 3.
Comparisons between DLT and DiCOT measurement results. Presentation is similar to that used in Fig. 2. (A) Shows a scatter plot with the ICCconsistency calculated as well as the linear regression between the two measures. Shaded purple area indicates 95% confidence interval. This regression is used to transform the DiCOT results to give the adjusted DiCOT in (B) that is put into better agreement with the DLT following the equation: Adjusted DiCOT = (DiCOT + 0.47)/0.45. (C) Shows the Bland Altman plot of the difference between the two measures plotted against the DLT result.

