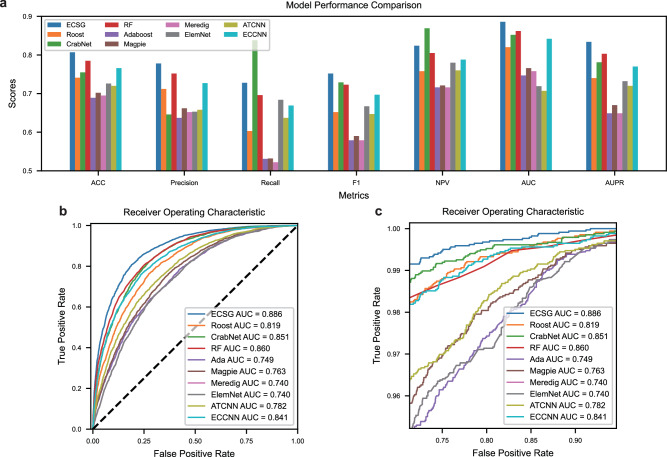
Fig. 2. Performance comparison of models across metrics and Area Under the Curve (AUC) curves.
a The hist plot of different models in terms of seven metrics. Source data are provided as a Source Data file. b AUC curves, and (c) zoomed AUC curves of different models. The comparison models include Electron Configuration models with Stacked Generalization (ECSG), Roost48, CrabNet69, Random Forest (RF), AdaBoost (Ada), Magpie30, Meredig31 ElemNet29, Atom Table Convolutional Neural Networks (ATCNN)37 and Electron Configuration Convolutional Neural Network (ECCNN).

