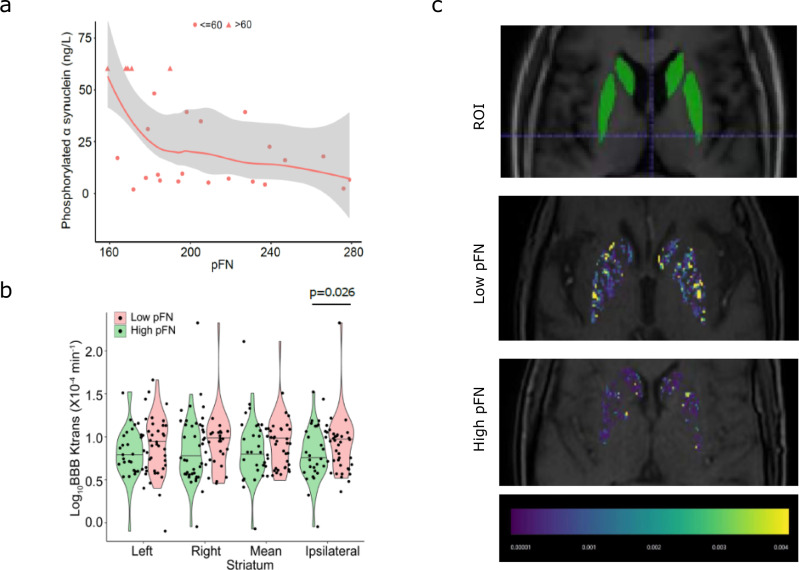
Fig. 5. Correlations between baseline pFN and phosphorylated α-synuclein, and baseline pFN and blood–brain barrier permeability of the striatum.
a Clinicopathologic correlation analysis revealed significant negative correlations between pFN and phosphorylated α synuclein (correlation coefficient, −0.456; p = 0.008) using the Spearman correlation test. b Comparison of Ktrans values in the striatum between the high-FN group and the low-FN group (left, right, average, and ipsilateral). c Representative images of BBB permeability in the low-pFN group and the high-pFN group, as well as a localization marker image of the region of interest. The T1 sequence was used to localize the striatum.

