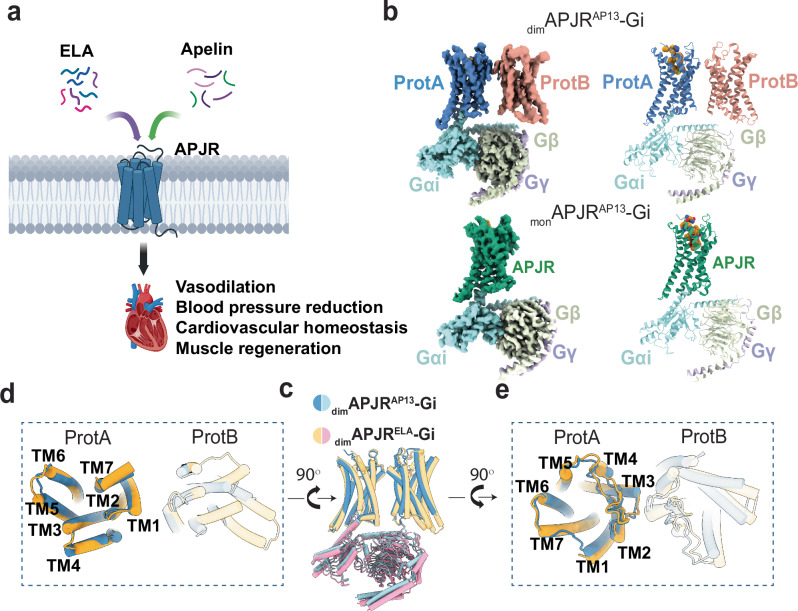
Fig. 1. Cryo-EM structures of the dimAPJRAP13-Gi and monAPJRAP13-Gi complexes and comparisons with dimAPJRELA-Gi complex.
a A model demonstrating the potential pharmacological effects induced by two endogenous peptide ligands on APJR. Created in BioRender. Yue, Y. (2025) https://BioRender.com/p30r650. b Cryo-EM maps and structure models of dimAPJRAP13-Gi complex and monAPJRAP13-Gi complex. Protomer primarily coupled with Gi is termed ProtA and non-coupled is termed ProtB. Apelin-13, yellow; ProtAAP13, blue; ProtBAP13, pink; monAPJRAP13, green. Gαi, Gβ and Gγ are in light cyan, light green and light blue, respectively. The ICL1 and ICL2 regions were disordered, and in ProtB, only the main chain was modeled due to insufficient side-chain density. Structural comparison between dimAPJRAP13-Gi and dimAPJRELA-Gi (PDB ID: 7W0N) in overall side view (c), intracellular view (d), and extracellular view (e), respectively.

