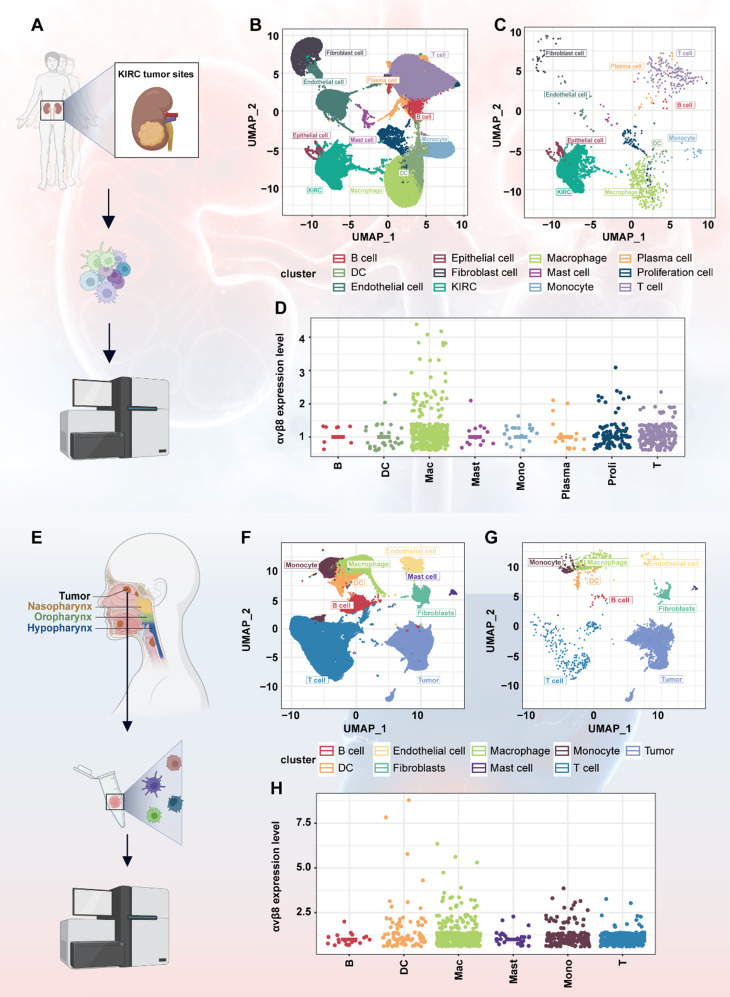
Fig. 1.
Integrin αvβ8 expression in KIRC and HNSCC as revealed by scRNA-seq analysis. (A) Ten freshly collected primary KIRC tissues were subjected to scRNA-seq analysis. (B) UMAP lots of KIRC patient cells, colored to depict the 12 identified clusters. (C) Distribution of ITGB8-expressing cells within each cluster of KIRC. (D) Point plot illustrating the distribution of ITGB8-expressing cells across various immune cell types in KIRC. (E) Analysis of 52 HNSCC tumor samples from individual patients as referenced in the literature. (F) UMAP plots of HNSCC patient cells, colored to show the 9 identified clusters. (G) Distribution of ITGB8-expressing cells within each cluster of HNSCC. (H) Point plot illustrating the distribution of ITGB8-expressing cells across various types of immune cells of HNSCC

