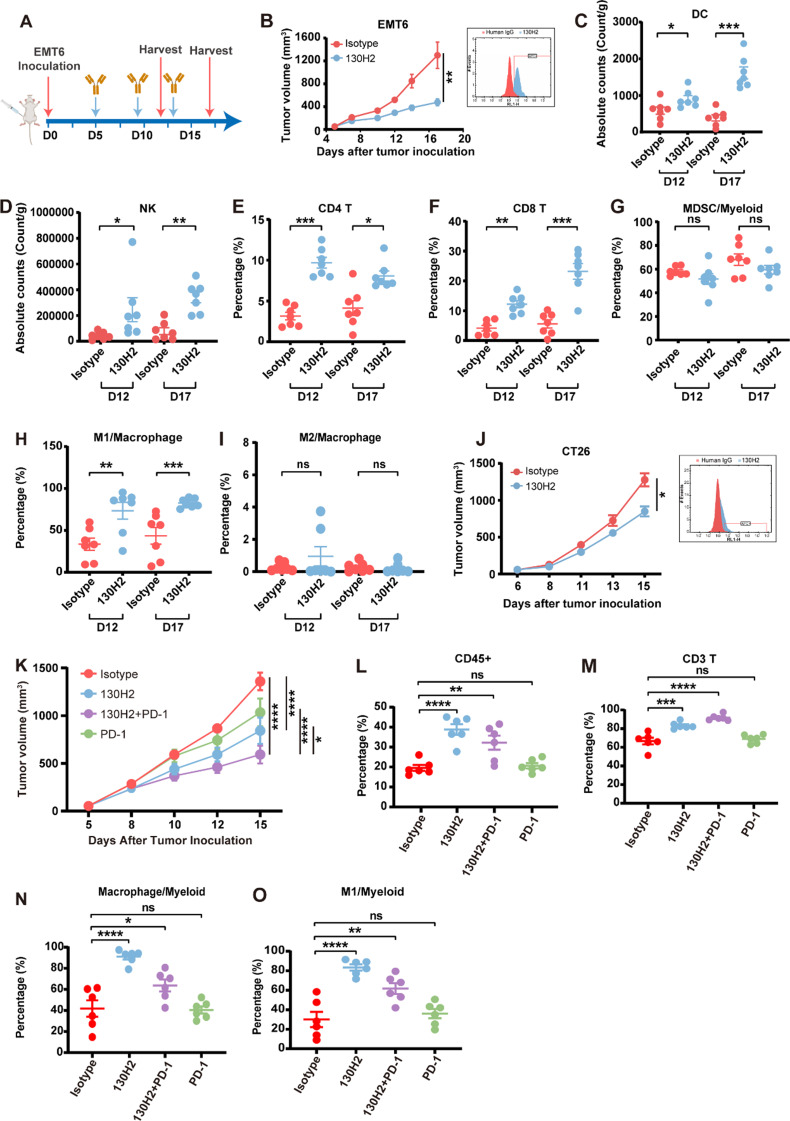
Fig. 4.
130H2 inhibited tumor growth by increasing immune cells infiltration. (A) Experimental schematics of the workflow for in vivo efficacy and TILs analysis. (B and J) BALB/c mice (n = 7) bearing EMT6 cells (B) and CT26 cells (J) were intraperitoneally treated with 10 mg/kg 130H2 or isotype antibody every four days on day 5, 9, 13 post inoculation, three times in total. Significance, *P < 0.05 by Student’s t-test, **P < 0.01 by Student’s t-test. The expression of αvβ8 in the EMT6 cell line and CT26 cell line before inoculation, visualized by staining with 130H2 antibody, is shown in the right. (C-I) BALB/c mice (n = 7 every time in each group) were sacrificed on day 12 and 17 after tumor inoculation and EMT6 tumors were dissociated to analyze tumor-infiltrating immune cells using FACS. Absolute number of cells per gram tumor tissue were calculated for populations of DCs (C) and NK cells (D). Proportion of CD4 + T cell (E) and CD8 + T cell (F) populations were determined by CD3 + CD4 + CD8- and CD3 + CD4-CD8 + markers. Myeloid cell populations including MDSC/myeloid ratio (G), M1/macrophage (H), and M2/macrophage (I) were evaluated. *P < 0.05, **P < 0.01, ***P < 0.001, ****P < 0.0001 were analyzed by Student’s t-test. P < 0.05 means statistical significance. (K) BALB/c mice (n = 6) bearing EMT6 cells were intraperitoneally administrated with the following treatments: 10 mg/kg isotype-hIgG1(day 5, 12) plus 10 mg/kg isotype-rat IgG2a (day 5, 9, 13), 10 mg/kg 130H2 (day 5, 12) plus 10 mg/kg isotype-rat IgG2a (day 5, 9, 13), 10 mg/kg PD-1 antibody (day 5, 9, 13) plus 10 mg/kg isotype-hIgG1 (day 5, 12), 10 mg/kg 130H2 (day 5, 12) plus 10 mg/kg PD-1 antibody (day 5, 9, 13). P < 0.0001 was indicated as ****, P < 0.05 as *, and statistical significance was determined by two-way ANOVA with Tukey’s multiple comparisons test. (L-O) BALB/c mice (n = 6 in each group) were sacrificed on day 15 post-tumor inoculation, and EMT6 tumors were dissociated for analysis of tumor-infiltrating immune cells using FACS. The proportions of CD45 + cell, CD3 + T cell, macrophages, and M1 macrophages were quantified. Statistical significance was determined by one-way ANOVA with Dunnett’s multiple comparisons. Data in figures B-O are presented as mean ± SEM

