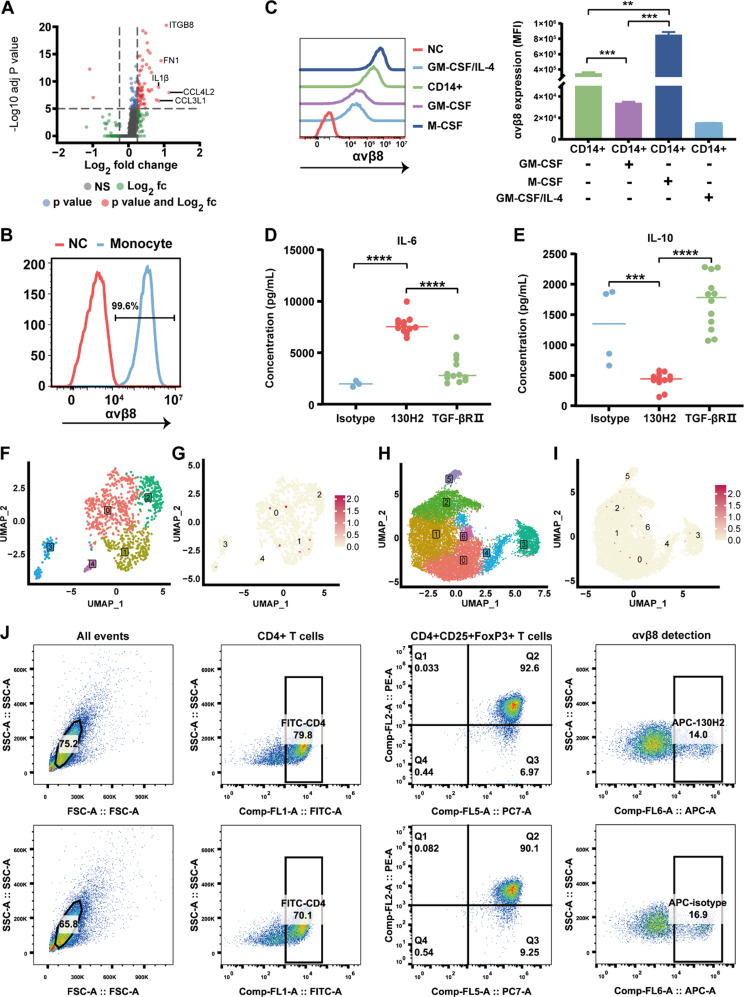
Fig. 5.
130H2 regulates macrophage polarization. (A) Volcano plot illustrating differentially expressed genes between ITGB8 + and ITGB8 − macrophages. Differential gene expression was calculated using the FindMarkers function with the Wilcoxon Rank Sum test in the Seurat package. The filtering criteria were set as: adjusted p-value (P-adj) < 0.05 and log2(fold change) ≥ 0.25. (B) The αvβ8 expression on monocyte isolated from PBMC by CD14 positive selection kit was detected by flow cytometry. NC represents the absence of staining. (C) Monocytes were differentiated to M1, M2 macrophages, and DCs stimulated by GM-CSF, M-CSF or GM-CSF/IL-4, respectively. The expression of αvβ8 on these myeloid cells was detected by FACS (left). Mean fluorescence intensity (MFI) values were quantified and presented as bar graphs (right), with statistical significance indicated. (D-E) CD14 + monocytes were stimulated by M-CSF for 4 days, followed by adding 130H2, TGFβRII trap or an isotype control for an additional 3 days. Cytokine levels of IL-6 and IL-10 were quantified by HTRF technology. (F-I) Feature plots showing the distribution of Treg subpopulations (F and H) and ITGB8 expression in Treg cells (G, I) derived from Figure 1. (J) Treg cells isolated from human PBMCs were stimulated with a CD3/CD28 activator and IL-2. CD4 + CD25 + FoxP3 + Tregs were detected using APC-labeled 130H2 or an APC-labeled isotype control. Representative data are shown. The data in figure C, D, E was shown as mean ± SEM. **P < 0.005, ***P < 0.0005, ****P < 0.0001 was determined by Student’s t-test

