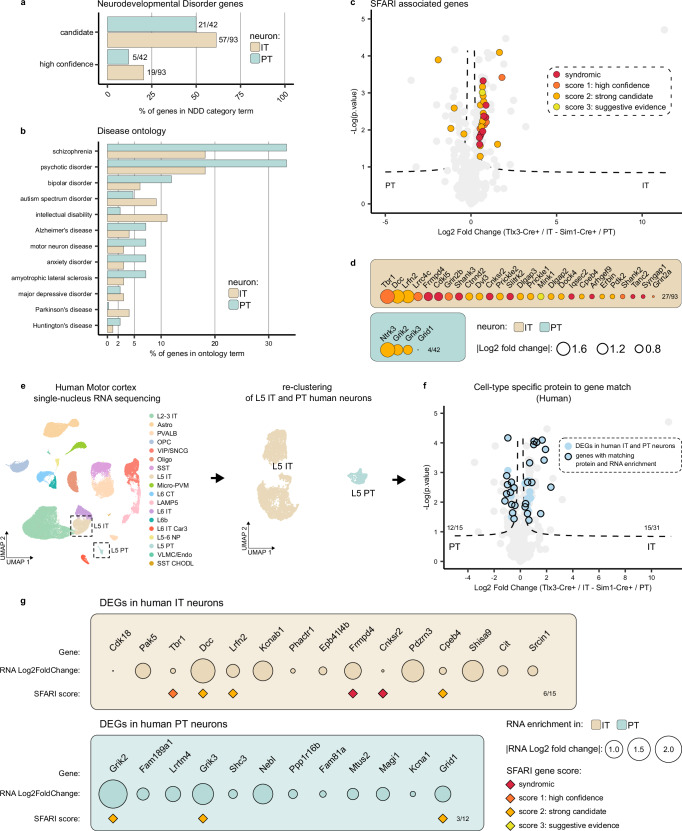
Fig. 5. Differential disease vulnerability of layer 5 neuron synaptic signatures.
a Percentage of synaptic genes per cell type present in the ‘high confidence’ or ‘candidate’ neurodevelopmental disorder lists based on the Genetrek database published in Leblond et al. 202132. b Percentage of synaptic genes per cell type present in each disorder term based on the synapse proteome database6. c Synaptic proteins in L5 IT and PT neurons with an ASD risk score annotation in the SFARI gene database33 are indicated on the volcano plot from Fig. 4a (two-sided, unpaired t-test with permutation-based FDR correction at 5%, s0 > 0.1). d ASD proteins identified in the SFARI database33 listed per cell type and ranked by protein log fold change. e L5 IT and PT neurons were extracted from published human motor cortex snRNA-Seq data61 and re-clustered. f Differentially expressed genes (DEGs) between human IT and PT neurons (adjusted p-value < 0.01 and log fold change > 0.25) were plotted on top of mouse synaptic proteins enriched in IT and PT neurons from Fig. 4a (two-sided, unpaired t-test with permutation-based FDR correction at 5%, s0 > 0.1) to evaluate their overlap. 12/15 DEGs matched PT neuron-enriched synaptic proteins, 15/31 DEGs matched IT neuron-enriched synaptic proteins. g Synaptic proteins from mouse L5 IT and PT neurons that show matching differential gene expression in human L5 IT and PT neurons are shown. SFARI scores are annotated, IT intratelencephalic, PT pyramidal tract.

