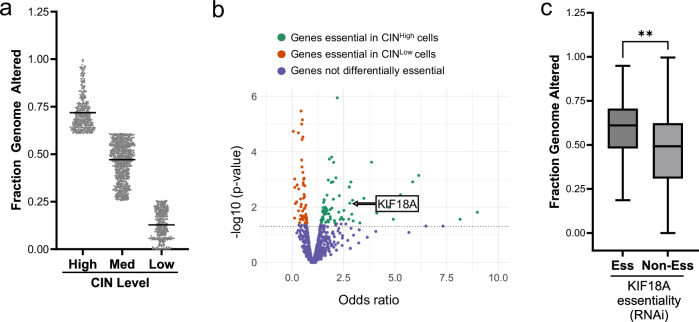
Fig. 1. Identification of KIF18A as a vulnerability of CINHigh tumors.
DEPMAP23 gene essentiality data was used to identify genes required for proliferation of CINHigh cells. a Categorization of CIN across 1660 cell lines as CINHigh (top quartile), CINMed or CINLow (bottom quartile) as measured by fraction genome altered (FGA). Data presented as mean values. Each dot represents 1 cell line. b Volcano plot visualizing the odds ratio from a Fisher’s Exact test to determine the association between RNAi essentiality scores and CIN, which identified genes that are significantly essential in CINHigh cell lines (FDR < 0.25). Each dot represents one gene. Genes in green are more essential in CINHigh cells, genes in red are more essential in CINLow cells, and genes in blue did not show differential essentiality. KIF18A p value = 0.0072 with a Fisher’s Exact test. c Cell lines requiring KIF18A for proliferation (Ess) exhibit higher median FGA compared to cell lines not requiring KIF18A for proliferation (Non-Ess) based on RNAi essentiality scores across 748 cell lines. Data presented as median (center) with 25th to 75th percentile bounds (boxes), minimum and maximum (whiskers). **p = 0.006 by unpaired, 2-tailed t test. Source data are provided in the Source Data file.

