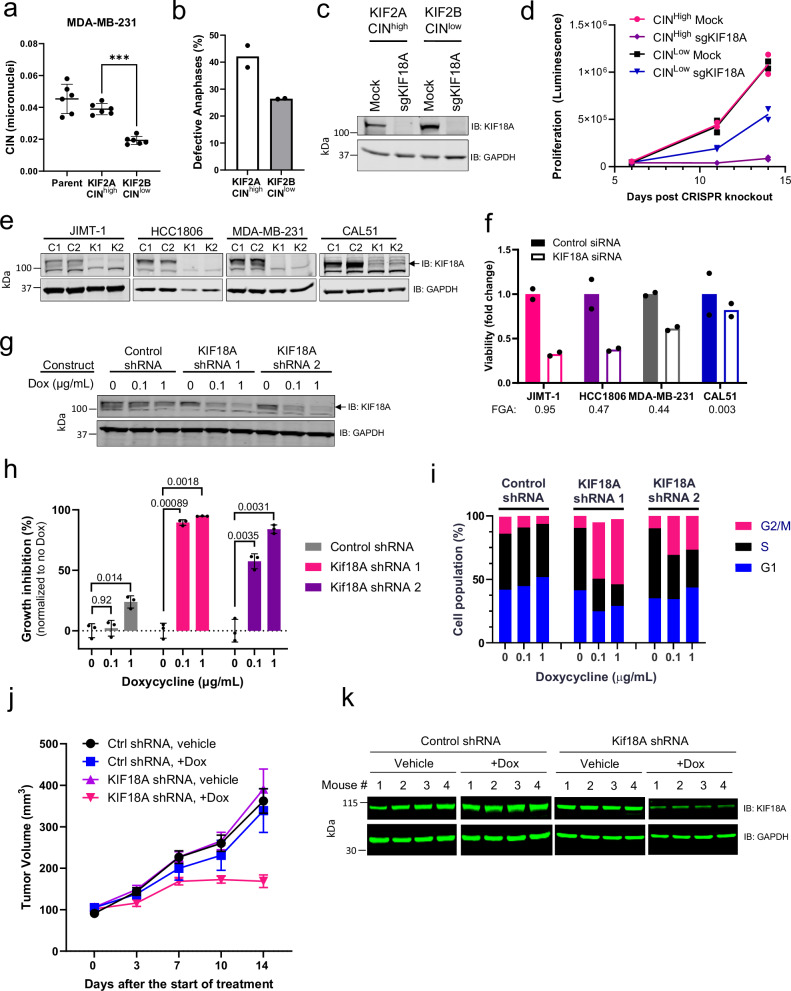
Fig. 2. Differential requirement of CINHigh vs. CINLow cells for KIF18A.
a Micronuclei levels (ratio of total micronuclei to total primary nuclei) in MDA-MB-231 cells over-expressing KIF2B or KIF2A compared to the parental line. Data presented as mean values -/+ SD from n = 6 biological replicates, ***p = 1.01 x 10⁻⁴ using one-way ANOVA with Dunnett’s multiple comparisons test. b Defective anaphases (as percentage of total anaphases) in MDA-MB-231 cells overexpressing KIF2A or KIF2B. Data presented as mean values from n = 2 biological replicates. c Western blot confirming CRISPR/Cas9-mediated KIF18A knockout. One representative experiment of 2 biological replicates is shown. d Proliferation (luminescence measured by CellTiter-Glo assay) upon KIF18A knockout. Data presented as individual values from n = 2 biological replicates. (e) Western blot of KIF18A knockdown (K1 and K2) compared to control siRNA (C1 and C2) 72 h after replating. Top panel: arrow indicates KIF18A (the highest band), bottom band is non-specific. One representative experiment of 2 biological replicates is shown. f Viability of cells shown in (e) 72 h after replating following siRNA transfection. Computed CIN values (FGA) of cell lines are indicated below the name. Data are presented as mean values from 2 biological replicates. g Western blot of KIF18A expression in engineered Dox-inducible KIF18A (shRNA 1 and 2) and Control (non-targeting) shRNA in JIMT-1 cells after 7 days Dox treatment. One representative experiment of 2 biological replicates is shown. h Proliferation of engineered Dox-inducible JIMT-1 cells measured after 10 days Dox treatment. Data presented as mean values +/- SD from n = 3 biological replicates. p values are indicated above the bars and determined by 2-way ANOVA with Tukey’s multiple comparisons test. i Cell cycle population frequencies in Dox-inducible KIF18A and Control shRNA JIMT-1 cells after 72 h of Dox treatment. Data presented as mean values from n = 2 biological replicates. j Tumor volume of Dox-inducible shRNA JIMT-1 xenografts implanted in SCID Beige mice (n = 4 mice per group). Data presented as mean values -/+ SEM. k Western blot of KIF18A expression from JIMT-1 xenograft tumors excised 4 days after initiation of Dox treatments. Source data are provided in the Source Data file.

