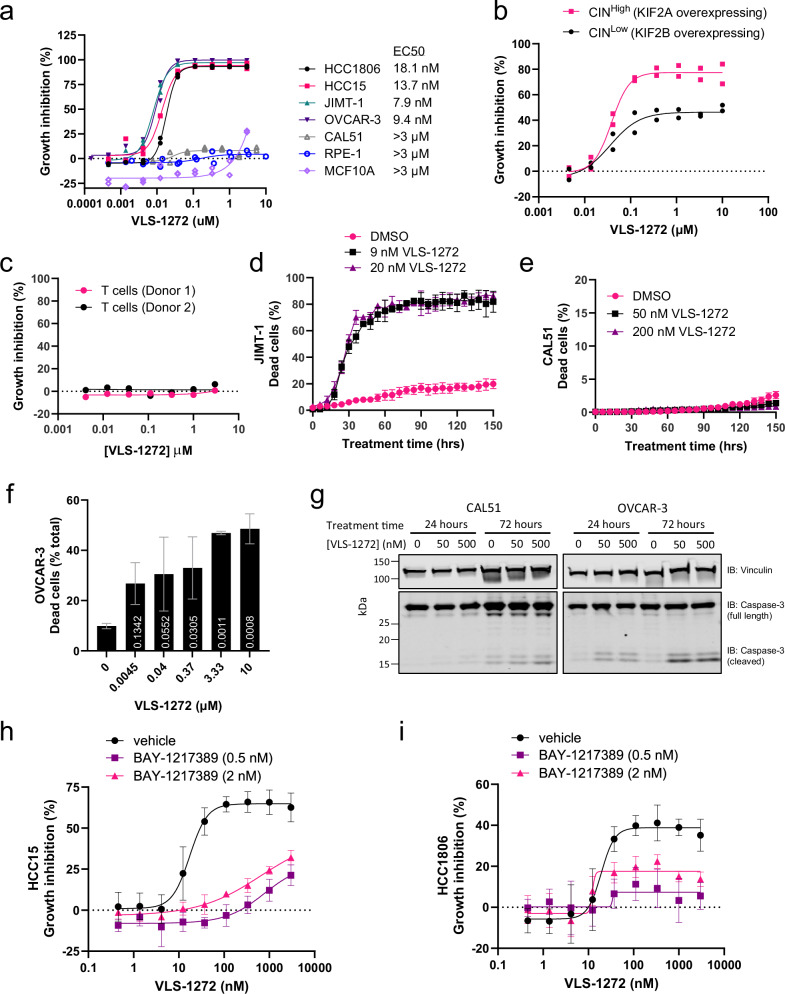
Fig. 4. Differential effects of KIF18A inhibition in cancer vs. normal cells.
a Growth inhibition as measured by CellTiter-Glo of indicated cancer and non-transformed epithelial cell lines after treatment with VLS-1272 for 168 h. Data presented as individual values from n = 2 biological replicates. b Proliferation of MDA-MB-231 cells over-expressing KIF2A (CINHigh) or KIF2B (CINLow) treated with VLS-1272 and assessed by CellTiter-Glo after 168 h of treatment. Data presented as individual values from n = 2 biological replicates. c Growth inhibition of primary T cells isolated from healthy donors after stimulation with αCD3/CD28 beads, treated with VLS-1272 and assessed by CellTiter-Glo after 72 h. Data presented as individual values from n = 2 donors. Dead cell (propidium iodide-positive cells) enumeration by live cell imaging in the presence of vehicle or indicated VLS-1272 concentration for 150 h in JIMT-1 cells (d) or CAL51 cells (e). Data presented as mean -/+ SD from n = 3 biological replicates. f Dead cell quantification by acridine orange/propidium iodide staining following 3-day treatment with the indicated concentrations of VLS-1272 in OVCAR-3 cells. Data presented as mean -/+ SD from n = 3 biological replicates. P values are calculated compared to untreated control and labeled on the corresponding bar, using one-way ANOVA with Dunnett’s multiple comparisons test. g Western blot of cleaved Caspase 3 (MW: 17 kDa) versus full length Caspase 3 (MW: 35 kDa) after 24- and 72 h treatment of CAL51 and OVCAR-3 cells with VLS-1272. One representative experiment of 2 biological replicates is shown. Growth inhibition as measured by CellTiter-Glo of HCC15 (h) and HCC1806 cells (i) after treatment with the indicated concentration of VLS-1272 with or without 0.5 or 2 nM BAY-1217389 (MPS1 inhibitor) for 3 days. Data presented as mean values -/+ SD from n = 4 biological replicates. Source data are provided in the Source Data file.

