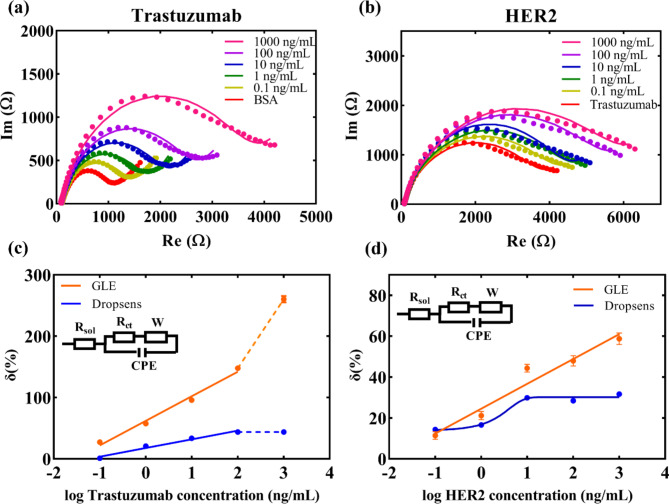
Fig. 3.
(a) Nyquist plots for different concentrations of trastuzumab; (b) Nyquist plots for different concentrations of HER2; (c) Comparison of the relative change of the signal versus BSA saturated electrode for different concentrations of trastuzumab – GLE and Dropsens responses; Results are presented as mean value of three measurements with standard deviation. (d) Comparison of the relative change of the signal versus trastuzumab saturated electrode for different concentrations of HER2 – GLE and Dropsens responses. Results are presented as a mean value of three measurements with standard deviation. The presented results demonstrate significantly better performance in sensor detection realized using GLEs compared to Dropsens electrodes.

