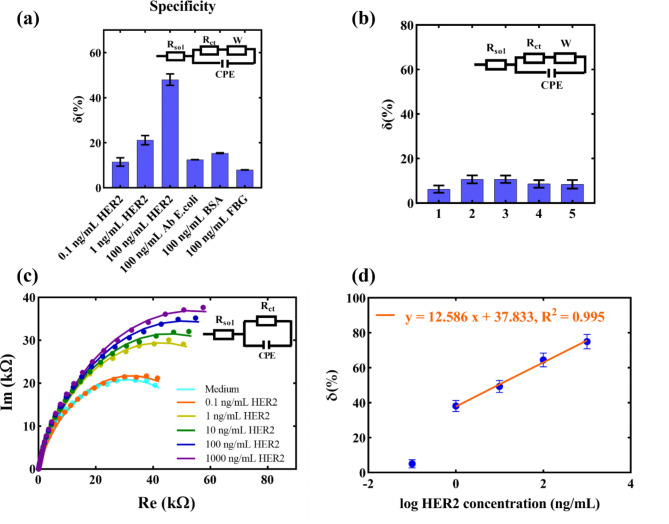
Fig. 4.
(a) Specificity tests for GLE-based HER2 immunosensor (AB = antibody, FBG = fibrinogen); Results are presented as mean value with standard deviation (n = 3). (b) Control test: Repeated cell culture medium incubation after surface saturation; Results are presented as mean value with standard deviation (n = 3). (c) Nyquist plots with an equivalent Randles circuit used for fitting the data of HER2 detection in cell culture medium; (d) Relative change of the signal versus medium saturated surface for different concentrations in the cell culture medium. Error bars in the graph present standard deviations of three measurements.

